

Afya Limited to Report Second-Quarter and First Half 2022 Financial Results on August 22nd

Afya Limited to Report Second-Quarter and First Half 2022 Financial Results on August 22nd

NOVA LIMA, Brazil–(BUSINESS WIRE)–Afya Limited, or Afya (Nasdaq: AFYA), today announced that it will report Second-Quarter and First Half 2022 Financial Results for the period ended June 30, 2022, following the close of the market on Monday, August 22nd, 2022 and will host a corresponding conference call and webcast at 05:00 pm ET.

A live and archived webcast of the call will be available on the Investor Relations section of the Company’s website at https://ir.afya.com.br/.

To participate in Afya’s Second-Quarter and First Half 2022 conference call, please follow the instructions below:

Webcast: https://afya.zoom.us/j/97592512411

Dial-in:

Brazil: +55 21 3958 7888 or +55 11 4632 2236 or +55 11 4632 2237 or +55 11 4680 6788 or +55 11 4700 9668

United States: +1 312 626 6799 or +1 646 931 3860 or +1 929 205 6099 or +1 301 715 8592 or +1 346 248 7799 or +1 669 444 9171 or +1 669 900 6833 or +1 253 215 8782

Webinar ID: 975 9251 2411

Other Numbers: https://afya.zoom.us/u/aeeKmxmFd

Afya also announces today the publication of its 2Q22 sell-side analysts’ consensus figures. The consensus figures are based on the forecasts of analysts who follow Afya results on a regular basis. This information was collected between July 15, 2022 and July 21, 2022, directly from the sell-side analysts.

These firms follow Afya on their own initiative and Afya is not responsible for their views. Afya is neither involved in the collection of the information nor in the compilation of the estimates.

R$ Million Bank 1 Bank 2 Bank 3 Bank 4 Bank 5 Bank 6 Average Median
Net Revenue

562

567

565

557

573

554

563

564

Adjusted EBITDA

213

217

217

224

211

211

216

215

Adjusted EBITDA Margin

38{21df340e03e388cc75c411746d1a214f72c176b221768b7ada42b4d751988996}

38{21df340e03e388cc75c411746d1a214f72c176b221768b7ada42b4d751988996}

38{21df340e03e388cc75c411746d1a214f72c176b221768b7ada42b4d751988996}

40{21df340e03e388cc75c411746d1a214f72c176b221768b7ada42b4d751988996}

37{21df340e03e388cc75c411746d1a214f72c176b221768b7ada42b4d751988996}

38{21df340e03e388cc75c411746d1a214f72c176b221768b7ada42b4d751988996}

38{21df340e03e388cc75c411746d1a214f72c176b221768b7ada42b4d751988996}

38{21df340e03e388cc75c411746d1a214f72c176b221768b7ada42b4d751988996}

Disclaimer

The consensus estimate is based on estimates, forecasts and predictions made by third party financial analysts. It is not prepared based on information provided or checked by Afya and can only be seen as a consensus view on Afya’s results from an outside perspective. Afya has not provided input on these forecasts, except by referring to past publicly disclosed information. Afya does not accept any responsibility for the quality or accuracy of any individual forecast or estimate. This press release may contain forward-looking statements based on current assumptions and forecasts made by Afya or third parties. Various known and unknown risks, uncertainties and other factors could lead to material differences between Afya’s actual future results, financial situation, development or performance, and the estimates given here. Further information on these and other factors that could affect our financial results is included in filings we make with the Securities and Exchange Commission from time to time, including the section titled “Risk Factors” in our most recent Rule 424(b) prospectus. These documents are available on the SEC Filings section of the investor relations section of our website at: https://ir.afya.com.br/.

About Afya:

Afya is a leading medical education group in Brazil based on the number of medical school seats, delivering an end-to-end physician-centric ecosystem that serves and empowers students and physicians to transform their ambitions into rewarding lifelong experiences from the moment they join us as medical students through their medical residency preparation, graduation program, continuing medical education activities and offering digital products to help doctors enhance their healthcare services through their whole career.

Analysts Have Made A Financial Statement On Medtronic plc’s (NYSE:MDT) Second-Quarter Report

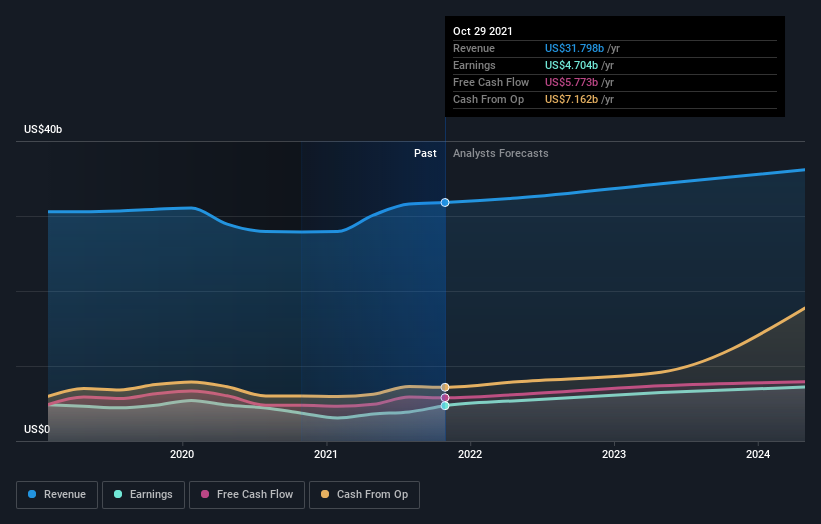
Last week, you might have seen that Medtronic plc (NYSE:MDT) released its second-quarter result to the market. The early response was not positive, with shares down 2.7{21df340e03e388cc75c411746d1a214f72c176b221768b7ada42b4d751988996} to US$114 in the past week. It was a credible result overall, with revenues of US$7.8b and statutory earnings per share of US$0.97 both in line with analyst estimates, showing that Medtronic is executing in line with expectations. This is an important time for investors, as they can track a company’s performance in its report, look at what experts are forecasting for next year, and see if there has been any change to expectations for the business. Readers will be glad to know we’ve aggregated the latest statutory forecasts to see whether the analysts have changed their mind on Medtronic after the latest results.

earnings-and-revenue-growthNYSE:MDT Earnings and Revenue Growth November 26th 2021

Taking into account the latest results, Medtronic’s 25 analysts currently expect revenues in 2022 to be US$32.4b, approximately in line with the last 12 months. Per-share earnings are expected to grow 12{21df340e03e388cc75c411746d1a214f72c176b221768b7ada42b4d751988996} to US$3.90. Yet prior to the latest earnings, the analysts had been anticipated revenues of US$33.0b and earnings per share (EPS) of US$3.96 in 2022. So it’s pretty clear that, although the analysts have updated their estimates, there’s been no major change in expectations for the business following the latest results.

There were no changes to revenue or earnings estimates or the price target of US$141, suggesting that the company has met expectations in its recent result. The consensus price target is just an average of individual analyst targets, so – it could be handy to see how wide the range of underlying estimates is. There are some variant perceptions on Medtronic, with the most bullish analyst valuing it at US$155 and the most bearish at US$127 per share. The narrow spread of estimates could suggest that the business’ future is relatively easy to value, or thatthe analysts have a strong view on its prospects.

Looking at the bigger picture now, one of the ways we can make sense of these forecasts is to see how they measure up against both past performance and industry growth estimates. It’s clear from the latest estimates that Medtronic’s rate of growth is expected to accelerate meaningfully, with the forecast 3.8{21df340e03e388cc75c411746d1a214f72c176b221768b7ada42b4d751988996} annualised revenue growth to the end of 2022 noticeably faster than its historical growth of 0.3{21df340e03e388cc75c411746d1a214f72c176b221768b7ada42b4d751988996} p.a. over the past five years. Compare this with other companies in the same industry, which are forecast to see revenue growth of 8.9{21df340e03e388cc75c411746d1a214f72c176b221768b7ada42b4d751988996} annually. So it’s clear that despite the acceleration in growth, Medtronic is expected to grow meaningfully slower than the industry average.

The Bottom Line

The most important thing to take away is that there’s been no major change in sentiment, with the analysts reconfirming that the business is performing in line with their previous earnings per share estimates. On the plus side, there were no major changes to revenue estimates; although forecasts imply revenues will perform worse than the wider industry. The consensus price target held steady at US$141, with the latest estimates not enough to have an impact on their price targets.

With that in mind, we wouldn’t be too quick to come to a conclusion on Medtronic. Long-term earnings power is much more important than next year’s profits. We have forecasts for Medtronic going out to 2024, and you can see them free on our platform here.

It is also worth noting that we have found 1 warning sign for Medtronic that you need to take into consideration.

This article by Simply Wall St is general in nature. We provide commentary based on historical data and analyst forecasts only using an unbiased methodology and our articles are not intended to be financial advice. It does not constitute a recommendation to buy or sell any stock, and does not take account of your objectives, or your financial situation. We aim to bring you long-term focused analysis driven by fundamental data. Note that our analysis may not factor in the latest price-sensitive company announcements or qualitative material. Simply Wall St has no position in any stocks mentioned.

Have feedback on this article? Concerned about the content? Get in touch with us directly. Alternatively, email editorial-team (at) simplywallst.com.

The views and opinions expressed herein are the views and opinions of the author and do not necessarily reflect those of Nasdaq, Inc.