
Oil, Data, and Dollars: Understanding USD/CAD Trading Signals

Oil, Data, and Dollars - Understanding USD-CAD Trading Signals

The foreign exchange market is vast and dynamic, shaped by the constant flow of global economic information, policy decisions, and shifting investor expectations. Among the many currency pairs traded globally, the US Dollar/Canadian Dollar (USD/CAD) occupies a unique position. This pair not only reflects the economic health of two major North American economies but also encapsulates the influences of commodity markets, particularly oil. For traders and analysts alike, interpreting signals in USD/CAD movements can offer valuable insights for strategic decision-making.

Understanding USD/CAD trading signals starts with appreciating the underlying forces that drive this exchange rate. In essence, USD/CAD represents how many Canadian dollars are required to purchase one US dollar, and its fluctuations are influenced by a blend of macroeconomic data, market sentiment, and global financial developments. Exploring these elements helps traders gauge potential opportunities and risks in a constantly evolving financial landscape.

The Interplay Between Oil and the Canadian Dollar

Canada is a major producer and exporter of crude oil, and its economy is closely tied to global energy markets. As a result, movements in oil prices frequently ripple through to the value of the Canadian dollar. Generally, when oil prices rise, there is upward pressure on the Canadian dollar due to increased revenue prospects for the Canadian economy. Conversely, a decline in oil prices can weaken the Canadian dollar.

Understanding this interdependence is critical when analysing USD/CAD trading signals. For instance, a sustained rally in crude oil prices may signal strengthening economic fundamentals for Canada, potentially narrowing the gap between USD and CAD valuations. Traders keep a close eye on data from energy markets, such as inventory reports, production changes, and geopolitical developments, because these can serve as early indicators of shifts in CAD strength.

At the same time, the US dollar often acts as a haven in times of global uncertainty. When investors seek refuge in perceived security, capital flows into USD assets can intensify, strengthening the dollar relative to commodity-linked currencies like the Canadian dollar. Recognising how oil market developments and broader risk sentiment converge is essential to interpreting USD/CAD signals effectively.

Key Economic Indicators Influencing USD/CAD

In addition to commodities, a range of macroeconomic indicators shape the USD/CAD exchange rate. These include interest rates, employment figures, inflation data, and trade balances. Each element offers a window into the strength and trajectory of the respective economies.

Interest rate differentials are particularly influential. Central banks, such as the Federal Reserve in the United States and the Bank of Canada, adjust policy rates in response to economic conditions. When the Federal Reserve raises interest rates, US assets may become more attractive to global investors seeking higher yields, supporting the USD relative to the CAD. If the Bank of Canada is simultaneously holding rates steady or lowering them, this differential can widen, influencing USD/CAD higher.

Employment data also attract attention as real-time reflections of economic momentum. Strong job growth and low unemployment in either country can bolster that currency’s strength. For example, robust Canadian employment figures might invigorate confidence in CAD, contributing to a potential downward adjustment in USD/CAD.

Deciphering Market Sentiment and Technical Signals

Beyond economic fundamentals, investor psychology and market sentiment play an indispensable role in shaping exchange rates. Traders often analyse sentiment to gauge the prevailing mood in currency markets, which can complement or sometimes even override fundamental narratives. For USD/CAD, understanding USD/CAD sentiment can offer useful context for short- and medium-term price dynamics.

Market sentiment can be assessed through a range of indicators, including speculative positioning data, options market pricing, and behavioural signals such as trend-following patterns or contrarian extremes. For example, if positioning data reveals that a growing proportion of traders are net long USD/CAD, this could signal collective expectations of future strength in the US dollar relative to the Canadian dollar. Conversely, a sentiment shift toward net short positioning could indicate expectations of CAD appreciation.

Integrating Data for Informed Decision Making

Harmonising economic data, sentiment analysis, and technical signals forms the cornerstone of informed USD/CAD trading strategies. Successful traders often begin by mapping out a macroeconomic thesis based on global and regional developments. This could involve anticipating the likely trajectory of interest rates or assessing the potential impact of forthcoming economic releases.

Next, integrating sentiment indicators helps to contextualise how market participants are positioning relative to these expectations. Are traders broadly optimistic or pessimistic about the prospects for CAD? Are there signs of positioning stress that might precede a sharp reversal in rates?

Finally, technical analysis can refine the timing of trades and highlight key levels where price action may accelerate or stall. For example, if fundamental data points to CAD strength over the coming months but technical levels suggest near-term resistance in USD/CAD, a trader might adjust their timing or position size accordingly.

Conclusion

Trading the USD/CAD pair offers a compelling intersection of macroeconomics, commodity markets, and investor psychology. Because the Canadian dollar carries a significant commodity component through oil, understanding how energy markets interact with broader economic indicators is vital. 

At the same time, sentiment and technical patterns provide additional layers of insight that can refine strategic decisions.
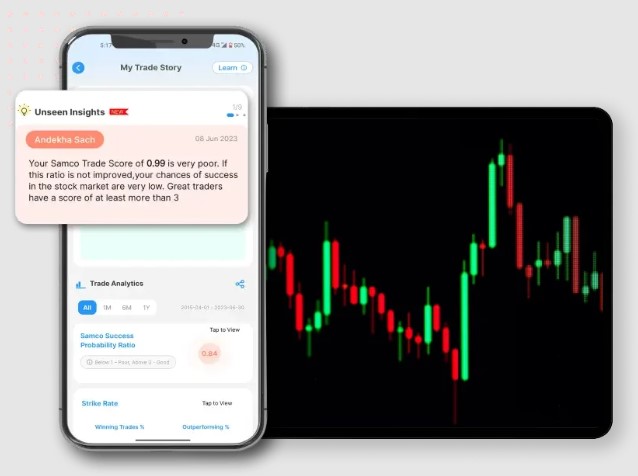
Introducing Samco’s Options BRO: Build, Research, and Optimise

Introducing Samco’s Options BRO: Build, Research, and Optimise

Samco trading app

The options market may seem like a market segment that can help you turn quick profits. However, it is far from merely speculative trading. Most traders do not understand this, which is why options trading is often misinterpreted and considered similar to gambling or winning the lottery. This attitude explains why many FnO traders only hold an option for less than 30 minutes on average!

They do not have any strategy in place. They often rely on naked options trading. And needless to say, they end up with massive losses. A recent study conducted by the Securities and Exchange Board of India (SEBI) quantifies this accurately; 9 out of 10 F&O traders (or 90{4a83339266b251883ae09f47f7d39cbb9b153acf42d523c83e932d3890d6471d} of them) endure losses in the market. The average loss size is also significant — coming in at ₹1.1 lakhs!

In case you too have been unsuccessful in options trading, you’re not alone. Many traders have trouble finding the right options trading strategy for success. It is also nearly impossible to analyse multiple metrics in a fast-paced market. But do you want to overcome these limitations and improve your options trading profits?

If you answered yes to that, we at Samco Securities have just the solution you’re looking for. Say hello to Options BRO — our proprietary and pioneering options strategy builder.

A Closer Look at Options BRO: Build, Research and Optimise 

Options BRO, a flagship feature in the Samco trading app, revolutionises options trading by addressing three fundamental aspects of participating in the F&O market — Build, Research and Optimise. Each aspect of our options strategy builder is designed to empower traders in the options market, so they can navigate the complexities of this segment more easily and efficiently.

Here’s how Options BRO helps you build, research and optimise every trading strategy that you may execute in the derivatives segment.

  • Build: The First Step to Options Trading Success 

Building a strategy is foundational to improving your trading performance. Instead of blindly opting for naked positions, you can use Options BRO to create a well-hedged strategy that aligns with your specific market outlook — whether you anticipate volatility or expect a bullish, bearish or neutral market.

For instance, say you anticipate a significant uptick in the price of a particular stock due to a positive earnings report. Using Options BRO, you can build a bullish strategy like a bull call spread and select the suitable call options that align with the price movement you forecast.

With Options BRO in the Samco trading platform, you can factor in the strike price and expiration dates of the options you’re interested in. You can also visualise the potential outcomes and profitability when you are building a strategy. What’s more, the Samco trading app also gives you an intuitive interface laden with real-time data — thus simplifying the complex process of formulating an options strategy. You can use our strategy builder to experiment with various combinations and scenarios without needing extensive background knowledge in options trading.

  • Research: To Analyse Your Options Strategy 

Once you have chosen and built a strategy using Options BRO in the Samco trading app, you need to research the strategy you’ve curated. You can use the extensive repository of research metrics in Options BRO to compare different options strategies. This research is pivotal for understanding the nuances and potential outcomes of each strategy under various market conditions.

For example, say you have built a bear put spread. You can use Samco’s Options BRO to explore various aspects of that position, assess historical performance data, look into payoff diagrams and analyse multiple scenarios with different target dates. This helps you fine-tune the approach based on thorough research.

Researching your strategy on the Samco trading platform is crucial because you can refine your trade based on empirical evidence and projections. With Options BRO, it is easier to thoroughly analyse your potential market position because we have integrated the options Greeks in this flagship feature. Once you gain a deeper understanding of options trading dynamics, you can navigate the market more effectively and improve your trading success.

  • Optimise: To Find the Ideal Risk-Reward Balance

Every option strategy has two sides — the risks and the rewards. Once you’ve built and researched your strategy, you need to optimise it to strike the optimal risk-reward balance. Then, and only then, is your strategy fit to be executed in the market. Without a strategy builder like Options BRO, you may end up trading naked options, where the risks far outweigh any potential rewards — especially if you are the option seller.

In the Samco trading app, you get strategy recommendations for each risk profile: be it aggressive, moderate or conservative. By accounting for varying risk appetites among traders, Options BRO revolutionises F&O trading in a never-before-seen manner.

The strategy builder analyses various parameters like the probability of profit, maximum loss and maximum gain to recommend strategies that best fit your outlook and risk tolerance. For instance, if you want to minimise the risk while seeking a decent profit margin, you can use Options BRO to filter out strategies that offer a favourable balance between the two. You can also adjust the strike prices or expiry dates as needed to find the optimal outcomes.

How to Use Options BRO to Build, Research and Optimise Your F&O Trades?

To use this new, groundbreaking feature in the Samco trading app, you only need to submit three key details:

  • The scrip or option that you want to trade in
  • The expiration date for that scrip
  • Your market outlook, which may be bullish, bearish, neutral or volatile

Once you’ve submitted these details, simply sit back and relax. Samco’s Options BRO then performs over 1.5 lakh mathematical computations, evaluates more than 2,000 option contracts and analyses over 1,000 option trading strategies — all in just a few seconds. Thereafter, once the complex analysis is complete, Options BRO gives you the top 3 trading strategies that align with your inputs.

Why three, you ask? That’s because we’ve designed this flagship feature in the Samco trading app to offer one top strategy for each risk profile — so aggressive, moderate and conservative traders can all trade in the right strategy at the right time and take calculated risks for better returns.

If you want to explore more strategies that fit in with your market outlook, Options BRO doesn’t disappoint. Beyond the top 3 strategies, you can also explore, research and optimise hundreds of other strategies that may be suitable for the market view you hold.

Become a Better Options Trader with Options BRO

True to its name, this industry-first tool helps you build, research and optimise your options trades seamlessly. If you’re wondering how much you’ll have to set aside each month to access this revolutionary feature, we have some great news for you. Samco Securities offers Options BRO to traders free of cost.

All you need to do is join the Samco community and download the Samco trading app to explore Options BRO at zero cost!

Financial Analysts Buzzing Over Donoghue Forlines LLC’s Acquisition of TotalEnergies SE Shares

Financial Analysts Buzzing Over Donoghue Forlines LLC’s Acquisition of TotalEnergies SE Shares

On May perhaps 8, 2023, economic analysts were being buzzing about Donoghue Forlines LLC’s recent acquisition of TotalEnergies SE (NYSE:TTE) shares. According to their most latest submitting with the Securities and Exchange Commission, this institutional investor purchased an supplemental 9,054 TTE shares in the fourth quarter of the past 12 months, rising their stake in the strength big by a whopping 76.8{21df340e03e388cc75c411746d1a214f72c176b221768b7ada42b4d751988996}. This brought their full holding to 20,845 shares worthy of $1,294,000 at the end of Q4.

TotalEnergies experienced currently made headlines on February 8th when it described its earnings effects for Q4. With $2.97 EPS for that quarter alone – beating analysts’ consensus estimates by $.04 – the corporation had acquired profits totaling an amazing $63.88 billion general. State-of-the-art study has forecasted that TotalEnergies SE would article all over 10.89 earnings for each share for the recent fiscal yr.

As a multinational corporation headquartered in France specializing in exploration and creation of fuels as nicely as normal fuel and small-carbon electrical power, TotalEnergies operates in 4 most important business segments: Exploration & Manufacturing Built-in Gasoline Renewables & Ability Refining & Chemical compounds and Advertising and marketing & Companies. Its Exploration & Output branch is largely concerned in oil and pure fuel exploration and creation activities.

Overall, investing in TotalEnergies at the moment provides strong prospective for progress offered its tested keep track of record of reliable earnings studies across its various organization segments paired with its concentrate on environmentally friendly energies. No matter whether buyers will go on to see sizeable returns from this energy heavyweight stays to be noticed but current indicators propose it’s a promising option going ahead for individuals searching to invest their money wisely in just a assorted portfolio.

TotalEnergies Ordeals Changes in Share Ownership and Raises Dividend Produce


TotalEnergies, a world oil and fuel company, has seasoned major changes in its share ownership lately as a number of institutional traders have either amplified or diminished their stakes. Arrowstreet Funds Limited Partnership boosted its holdings by in excess of 40{21df340e03e388cc75c411746d1a214f72c176b221768b7ada42b4d751988996} in the course of the initially quarter, resulting in it owning above 6 million shares truly worth $321 million. Equally, BNP Paribas Arbitrage SA reported an raise of 262,768.3{21df340e03e388cc75c411746d1a214f72c176b221768b7ada42b4d751988996}, bringing the complete amount of shares owned to nearly 2 million well worth $92 million. These adjustments were accompanied by Sound Shore Administration Inc CT and Instructors Retirement Technique of The State of Kentucky getting new positions in the organization. Natixis Advisors LP also reported a rise in their TotalEnergies holdings by virtually 100{21df340e03e388cc75c411746d1a214f72c176b221768b7ada42b4d751988996}, with about 1.5 million shares worthy of $93 million. All jointly, institutional buyers hold all around 6.63{21df340e03e388cc75c411746d1a214f72c176b221768b7ada42b4d751988996} of TotalEnergies’ inventory.

Despite these fluctuations in share ownership, TotalEnergies’ stock price has remained somewhat stable as it continues to trade on NYSE TTE at all over $62 for every share. Its market place capitalisation stands at $154 billion with a value-to-earnings ratio of 7.36 and a beta of .79 – both of those deemed indicators that make this stock a relatively fantastic invest in for anyone trying to get a lot more regular returns in the power sector.

TotalEnergies operates 4 most important company segments – Exploration & Production Built-in Gasoline, Renewables & Energy Refining & Chemical compounds and Promoting & Solutions – all targeted on providing small carbon electricity alternatives all over the world when maximising shareholder price concurrently.

Accompanying this news is the announcement that TotalEnergies has raised its dividends figures from previous year’s offerings. Its new quarterly dividend is now $.543 for each share in comparison to previous year’s charge of $.53, translating to an annualized benefit of $2.17 for each share in dividends or a 3.50{21df340e03e388cc75c411746d1a214f72c176b221768b7ada42b4d751988996} yield.

Even though this transfer marks an intriguing advancement for TotalEnergies and its shareholders, it is well worth noting that Goldman Sachs downgraded the company from a invest in rating to a neutral score previously in the calendar year nevertheless, several other equities analysts have presented TotalEnergies scores of ‘outperform’ and ‘overweight.’ As this kind of, Bloomberg’s present-day consensus is that TotalEnergies has a moderate invest in ranking with an normal goal price of $63.70 for every share.

Glenview Trust Co Increases Holdings in Raytheon Technologies Co, as Financial Analysts Remain Positive on Stock Performance

Glenview Trust Co Increases Holdings in Raytheon Technologies Co, as Financial Analysts Remain Positive on Stock Performance

Glenview Rely on Co has reportedly increased its holdings in Raytheon Technologies Co by 3.9{21df340e03e388cc75c411746d1a214f72c176b221768b7ada42b4d751988996} throughout the fourth quarter, with the addition of a complete of 3,735 shares in the company’s stock. In accordance to its most the latest submitting with the Securities and Trade Commission (SEC), Glenview Have confidence in Co’s total possession in Raytheon Systems is now all over 100,569 shares, valued at $10,149,000 as of May 6th, 2023.

This most recent information will come just after Raytheon Systems discovered its earnings outcomes on April 25th before this yr. The organization reportedly reported $1.22 EPS for Q1 in 2023, beating consensus estimates by $.09 for each share. Whole income came in at somewhere around $17.21 billion, up from estimates of around $16.98 billion for the very same period.

Right after experiencing an raise of in excess of 9{21df340e03e388cc75c411746d1a214f72c176b221768b7ada42b4d751988996} YoY in income, analysts are cautiously optimistic about foreseeable future prospective buyers for Raytheon Technologies stock (NYSE:RTX). In March this calendar year, StockNews.com assumed protection on the inventory and issued a “buy” score for it.

In late April 2023, Citigroup lifted their price goal on RTX from $106 for each share to $113.50 for every share. Robert W Baird also greater its target selling price from $106 to $115 for each share around the exact time.

Despite all these constructive testimonials and rankings about RTX recently, Jefferies Fiscal Team brought down their rating from a “buy” to a “hold”, dropping the value concentrate on for their proposed expenditure value from $115 to just $110 on April 20th this 12 months.

Last but not least, Wolfe Investigate upgraded shares of RTX after all over again – this time from “peer perform” to “outperform”, placing its selling price focus on on Might 12th at an even larger level than that of Citigroup or Robert W Baird – at $117 for every share.

With all these studies and figures out in the open now, fiscal analysts are anticipating RTX to submit earnings of all over 5.05 per share for the existing fiscal year. Primarily based on knowledge from Bloomberg.com, most resources look to have settled on an common rate focus on of approximately $111.88 for Raytheon Systems – once more reflecting an overall good outlook about how its inventory is possible to conduct in the close to future.

Institutional Investors and Hedge Cash Exhibit Interest in Raytheon Technologies, but Long-Expression Efficiency Unclear


Raytheon Systems, a multinational protection and aerospace business, has attracted the attention of institutional buyers and hedge resources in modern months. Cambridge Investment decision Investigation Advisors Inc. improved its posture in the business by 15.2{21df340e03e388cc75c411746d1a214f72c176b221768b7ada42b4d751988996} all through the fourth quarter, now proudly owning over 254,000 shares worthy of $25,703,000. Meanwhile, Gerber Kawasaki Wealth & Expense Management ordered an further 7,083 shares all through the past quarter to elevate its stake by 134.5{21df340e03e388cc75c411746d1a214f72c176b221768b7ada42b4d751988996}. In general, institutional buyers and hedge cash now individual practically 80{21df340e03e388cc75c411746d1a214f72c176b221768b7ada42b4d751988996} of Raytheon Technologies’ inventory.

Shares of Raytheon Systems traded at $96.16 on May 6, 2023, with a marketplace capitalization of $140.50 billion. Its 50-working day relocating regular was $98.92 although its 200-working day moving typical was $97.91. The firm’s present ratio stood at 1:13 and brief ratio at :85.

Raytheon Systems has acquired a number of latest analyst experiences with StockNews.com issuing a “buy” ranking for the company although Robert W. Baird elevated their concentrate on selling price from $106 to $115 on April 26th. On the other hand, Jefferies Financial Team downgraded the company’s rating from “buy” to “hold” and dropped its selling price target from $115 to $110.

The corporation just lately introduced a quarterly dividend enhance from $.55 to $.59 for every share set to be compensated out on June 15th, with stockholders recorded on May well 19th becoming qualified for it.

Nonetheless, in February this calendar year vice president Amy L Johnson sold more than a few thousand shares in Raytheon Technologies valued at roughly $356 thousand pounds This would counsel that insiders at the moment individual only around 0.11{21df340e03e388cc75c411746d1a214f72c176b221768b7ada42b4d751988996} of Raytheon Technologies’ stock irrespective of publishing pretty solid financials considering the fact that its merger in early 2020.
 
Total even though, inspite of some interest from institutional investors and favourable scores from a amount of analysts, it may perhaps nonetheless be unclear how nicely Raytheon Systems will perform in the prolonged expression.

National Bank Financial Analysts Lift Earnings Estimates for TMX Group Limited (TSE:X)

National Bank Financial Analysts Lift Earnings Estimates for TMX Group Limited (TSE:X)

TMX Group Minimal (TSE:X – Get Ranking) – Equities researchers at Countrywide Bank Money upped their FY2023 EPS estimates for shares of TMX Team in a analysis observe issued on Tuesday, May 2nd. Countrywide Financial institution Money analyst J. Gloyn now forecasts that the company will write-up earnings of $7.54 per share for the calendar year, up from their preceding forecast of $7.51. The consensus estimate for TMX Group’s current total-calendar year earnings is $7.61 for each share.

A quantity of other research companies also not long ago issued studies on X. BMO Money Marketplaces lifted their selling price target on shares of TMX Team from C$155.00 to C$158.00 in a investigate report on Wednesday. Countrywide Bankshares increased their target value on TMX Group from C$148.00 to C$152.00 and gave the corporation a “sector conduct” rating in a report on Tuesday. Deutsche Lender Aktiengesellschaft slash their cost goal on TMX Team from C$145.00 to C$143.00 in a report on Wednesday, February 8th. TD Securities greater their price aim on TMX Team from C$145.00 to C$150.00 and gave the organization a “maintain” score in a exploration be aware on Wednesday. Finally, Scotiabank boosted their target price tag on shares of TMX Team from C$159.00 to C$161.00 in a investigation take note on Thursday.

TMX Group Inventory General performance

Shares of X opened at C$139.70 on Friday. TMX Group has a 1 12 months very low of C$123.03 and a 1 12 months large of C$142.92. The inventory has a marketplace capitalization of C$7.78 billion, a P/E ratio of 14.21, a P/E/G ratio of 12.65 and a beta of .55. The enterprise has a debt-to-equity ratio of 26.38, a brief ratio of .01 and a recent ratio of 1.00. The firm’s fifty working day relocating ordinary is C$135.96 and its two-hundred working day moving common is C$135.29.

TMX Group (TSE:X – Get Ranking) previous issued its earnings results on Monday, February 6th. The enterprise reported C$1.74 earnings per share (EPS) for the quarter, beating the consensus estimate of C$1.73 by C$.01. The company experienced profits of C$274.10 million in the course of the quarter, as opposed to analyst estimates of C$280.68 million.

TMX Team Dividend Announcement

The organization also not long ago introduced a quarterly dividend, which will be paid on Friday, June 2nd. Stockholders of report on Friday, June 2nd will be compensated a dividend of $.87 for each share. The ex-dividend date is Thursday, May perhaps 18th. This signifies a $3.48 annualized dividend and a dividend produce of 2.49{21df340e03e388cc75c411746d1a214f72c176b221768b7ada42b4d751988996}. TMX Group’s dividend payout ratio is presently 35.40{21df340e03e388cc75c411746d1a214f72c176b221768b7ada42b4d751988996}.

TMX Team Business Profile

(Get Rating)

TMX Team Minimal operates exchanges, markets, and clearinghouses mainly for funds marketplaces in Canada and internationally. The company operates by way of 4 segments: Worldwide Remedies, Insights & Analytics Capital Development Derivatives Investing and Clearing and Equities and Set Cash flow Trading & Clearing.

Further Looking at

This immediate information notify was produced by narrative science engineering and financial data from MarketBeat in order to supply visitors with the swiftest and most precise reporting. This tale was reviewed by MarketBeat’s editorial group prior to publication. Make sure you send any thoughts or comments about this story to contact@marketbeat.com.

Just before you look at TMX Group, you will want to hear this.

MarketBeat retains monitor of Wall Street’s major-rated and ideal performing investigation analysts and the shares they propose to their shoppers on a day-to-day basis. MarketBeat has discovered the five shares that prime analysts are quietly whispering to their customers to purchase now ahead of the broader market catches on… and TMX Team was not on the list.

While TMX Group presently has a “Maintain” score among analysts, top-rated analysts consider these 5 stocks are much better purchases.

View The 5 Stocks In this article

A Guide To High-Short-Interest Stocks Cover

Cedar Fair LP receives positive ratings from financial analysts.

Cedar Fair LP receives positive ratings from financial analysts.

Cedar Honest LP, a well-regarded operator of amusement parks, outdoor and indoor drinking water parks, and hotels, has been producing waves in the inventory current market these days. According to Bloomberg Scores experiences, Cedar Good has gained a “Moderate Buy” advice from eleven analysis companies that are at this time covering the organization. This comes as no surprise as Cedar Fair has been persistently providing fantastic consumer experiences across all its areas.

The amusement parks operated by Cedar Honest include things like preferred names these kinds of as Cedar Position, Kings Island, Canada’s Wonderland, Dorney Park and Wildwater Kingdom, Valleyfair, Kings Dominion, Worlds of Enjoyable, Knott’s Berry Farm and California’s Excellent America. These areas attract millions of site visitors every calendar year who appear to get pleasure from thrilling roller coasters and other exciting rides.

Curiously enough, two financial investment analysts have rated Cedar Fair’s stock with a hold ranking though 4 have offered it a purchase score. Additionally, the regular 12 month value objective amongst analysts that have up-to-date their protection on the stock in the final calendar year is $53.11.

Shares of Cedar Fair opened at $40.29 on Friday which may well seem to be lower but need to not problem prospective buyers due to fluctuations staying typical in the inventory market. The company’s fifty-day relocating common stands at $44.18 whilst its 200 working day moving average will come in at $42.33 – both indicating continual advancement above time.

Inspite of its highs and lows during the calendar year, Cedar Fair retains a market capitalization of $2.08 billion with a PE ratio of 7.38 and beta score of 1.45 – indicating that this could be an exceptional very long-time period financial commitment option.

In general, if you’re thinking about investing in Cedar Truthful LP any time before long know that it is obtaining optimistic rankings from main monetary institutions for superior reason – they’ve got what it usually takes to offer lucrative returns for all those client plenty of to acquire edge!

Cedar Reasonable Stock Gets Positive Ratings from Multiple Companies and Institutions, Exhibiting Assure for Progress


Cedar Truthful has been the issue of various research stories, and its inventory has recently obtained several scores from various firms. On January 9th, Citigroup upgraded Cedar Fair’s selling price focus on from $47.00 to $49.00 and gave the inventory a “buy” ranking. Meanwhile, Rosenblatt Securities elevated the company’s price goal from $41.00 to $45.00 and assigned it a “neutral” score on February 22nd. On March 16th, StockNews.com began covering Cedar Truthful and issued a “buy” ranking for the amusement park operator’s shares.

Further more boosting trader confidence are current modifications made by institutional buyers as nicely as hedge resources, which have altered their holdings in Enjoyment (Cedar Truthful) appropriately. For instance, Virtu Monetary LLC extra new positions really worth about $235,000 in Cedar Fair just previous year.

In the same way, Strs Ohio improved its stake in the organization by 39.5{21df340e03e388cc75c411746d1a214f72c176b221768b7ada42b4d751988996} all through Q3 2016 and now owns about 113 thousand shares valued at $4.6 million just after shopping for an added 32 thousand shares around the past quarter by yourself. In addition, Schechter Expenditure Advisors acquired a new position in Exciting in Q3 valued at all around $391k even though Castleview Companions LLC obtained a new posture well worth about $67k for the duration of Q4 of previous 12 months.

Cedar Fair LP is primarily associated in setting up and operating amusement parks together with out of doors and indoor h2o parks as properly as inns all across North The us together with vital marketplaces these as California’s Terrific America and Knott’s Berry Farm between some others catering to households on the lookout for enjoyment-stuffed pursuits not just for young children but adults alike.

Finally, Enjoyment posted robust results for Q1 this 12 months with sound earnings for every share of about ($.20). In simple fact, this surpassed analysts’ expectations by net earnings of close to $.37 for each share reflecting a wholesome trajectory for advancement around time even amid a really aggressive industry. Moreover, it is crucial to take note that Enjoyable also a short while ago declared dividends of $.30 per share which is a obvious indicator of the company’s commitment to reward its shareholders handsomely and obtain very long-expression price generation for them as very well.