Attitudes begin to shift regarding monetary policy, economic growth, and stock prices

Attitudes begin to shift regarding monetary policy, economic growth, and stock prices

This post was originally published on TKer.co

Stocks declined, with the S&P 500 falling 1.1{21df340e03e388cc75c411746d1a214f72c176b221768b7ada42b4d751988996} last week. The index is now up 6.5{21df340e03e388cc75c411746d1a214f72c176b221768b7ada42b4d751988996} year to date, up 14.4{21df340e03e388cc75c411746d1a214f72c176b221768b7ada42b4d751988996} from its October 12 closing low of 3,577.03, and down 14.7{21df340e03e388cc75c411746d1a214f72c176b221768b7ada42b4d751988996} from its January 3, 2022 closing high of 4,796.56.

Over the past two weeks or so, it seems attitudes have begun to shift favorably regarding monetary policy, economic growth, and the trajectory of stock prices.

1. The Fed acknowledges inflation is coming down 🦅

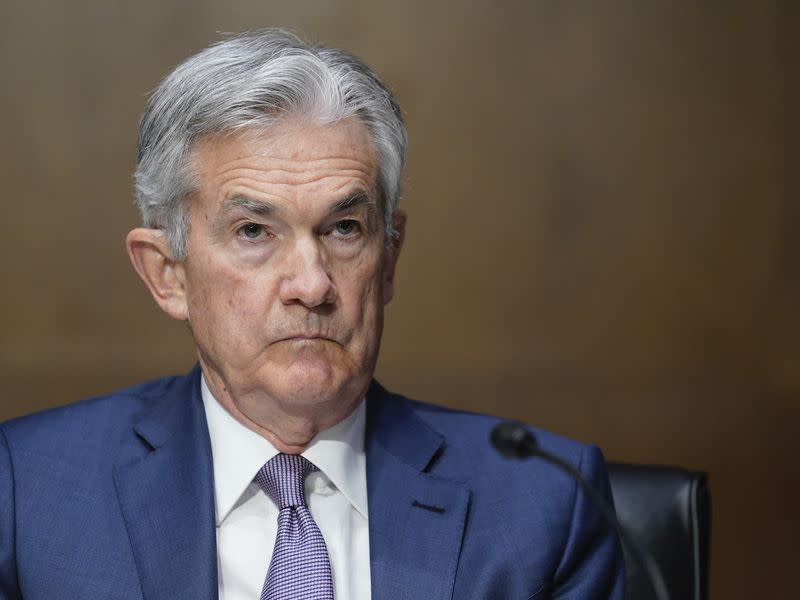
In May of last year, Fed Chair Jerome Powell warned “there could be some pain involved in restoring price stability.” A month later, we learned inflation was unexpectedly heating up again. And then on June 15, the Fed announced an eye-popping 75-basis-point interest rate hike, the largest increase the central bank made in a single announcement since 1994.

Back then, I explained how these dynamics presented a conundrum for the stock market as market beatings would continue until inflation improved in the Fed’s eyes.

Fast forward to February 1, following several months of cooling inflation data, when Powell said at the conclusion of the Fed’s monetary policy meeting: “We can now say, I think, for the first time that the disinflationary process has started. We can see that.“ (Emphasis added.)

The consumer price index has cooled significantly, signaling disinflation. (Source: BLS via <a data-i13n="cpos:1;pos:1" href="https://fred.stlouisfed.org/series/PCEPILFE#0" rel="nofollow noopener" target="_blank" data-ylk="slk:FRED;cpos:1;pos:1" class="link ">FRED</a>)
The consumer price index has cooled significantly, signaling disinflation. (Source: BLS via FRED)

“Powell cited the word ‘disinflation’ 13 times in this press conference,” Tom Lee, head of research at Fundstrat Global Advisors, wrote that day in a note to clients. “This is a major change in language and tone and shows that the Fed is now officially recognizing the growing disinflation forces underway. In [the December press conference], ‘disinflation’ was used ZERO times by Powell.”

This is a pretty big deal for the stock market, as prices tend to bottom in the weeks and months before major bullish developments. If this less hawkish tone from the Fed holds, then it’s possible the October 12 low for the S&P 500 was the beginning of the next bull market.

1

“In our view, Chair Powell is placing more weight on an ‘immaculate disinflation’ scenario, where inflation pressures subside without some softening in labor market conditions, including higher unemployment,” Michael Gapen, U.S. economist at BofA, wrote on Tuesday. “This stands in contrast to the Powell from Jackson Hole, Wyoming, last August, who leaned strongly into doing whatever it takes to bring inflation down and emphasized that inflation was unlikely to subside without some ‘pain’ in labor markets.”

As long as the inflation numbers continue to trend on the cooler side, the Fed seems likely to keep its less hawkish tone.

For more, read: TKer’s 2022 word of the year: ‘Pain’ 🥊, When the Fed-sponsored market beatings will end 📈, and The market beatings will continue until inflation improves 🥊.

Upgrade to paid

2. The economy is less likely to go into recession 💪

I can’t pinpoint exactly when the consensus among economists was that the U.S. was due for a recession. The worries certainly intensified after we learned GDP growth was negative in Q1 of last year, and they got a whole lot worse when we learned growth was negative in Q2 as well.

For more on how recessions are and aren’t defined, read: You call this a recession? 🤨.

Over this period, I’ve been skeptical of the idea that the U.S. was destined for a downturn given the massive economic tailwinds I couldn’t stop thinking about and still can’t stop thinking about.

Coming into 2023, the baseline expectation for many Wall Street firms was that the U.S. would enter a recession at some point during the year.

But after the robust January jobs report and expansionary January ISM Services survey earlier this month, sentiment among economists has shifted a bit.

On Monday, Goldman Sachs economist Jan Hatzius published a note titled, “Receding Recession Risk,“ in which he lowered the odds of the U.S. entering a recession in the next 12 months to 25{21df340e03e388cc75c411746d1a214f72c176b221768b7ada42b4d751988996} from 35{21df340e03e388cc75c411746d1a214f72c176b221768b7ada42b4d751988996}.

“Continued strength in the labor market and early signs of improvement in the business surveys suggest that the risk of a near-term slump has diminished notably,“ Hatzius wrote.

On Wednesday, we learned the Atlanta Fed’s GDPNow model saw real GDP growth climbing at a 2.2{21df340e03e388cc75c411746d1a214f72c176b221768b7ada42b4d751988996} rate in Q1. This metric is up considerably from its initial estimate of 0.7{21df340e03e388cc75c411746d1a214f72c176b221768b7ada42b4d751988996} growth as of January 27.

Recent economic data suggests economic growth is much stronger than forecasters expect. (Source: <a data-i13n="cpos:1;pos:1" href="https://www.atlantafed.org/-/media/documents/cqer/researchcq/gdpnow/RealGDPTrackingSlides.pdf" rel="nofollow noopener" target="_blank" data-ylk="slk:Atlanta Fed;cpos:1;pos:1" class="link ">Atlanta Fed</a>)
Recent economic data suggests economic growth is much stronger than forecasters expect. (Source: Atlanta Fed)

On Thursday, The New York Times published an article from Jeanna Smialek titled: “What Recession? Some Economists See Chances of a Growth Rebound.“ The title speaks for itself.

On Sunday, The Wall Street Journal published an article from Nick Timiraos titled: “Hard or Soft Landing? Some Economists See Neither if Growth Accelerates.“ It addresses the same themes.

All that said, it could take a few more weeks of resilient economic data before more economists officially revise their forecasts to the upside.

For more, read: 9 reasons to be optimistic about the economy and markets 💪 and The bullish ‘goldilocks’ soft landing scenario that everyone wants 😀.

Share

3. The stock market might not crater in the first half 📉

Many prominent Wall Street strategists warned that the S&P 500 was likely to sell-off sharply during the early part of 2023 before recovering at least some of those losses later in the year. This was driven by the expectation that expectations for earnings would continue to get revised lower.

But there were at least three issues with all this: 1) stocks often rise in years when earnings fall, 2) stocks usually bottom before earnings bottom, and 3) when many people expect stocks to sell-off for the same reason, then that information is likely to be already priced into the market.

The S&P 500 is up 6.5{21df340e03e388cc75c411746d1a214f72c176b221768b7ada42b4d751988996} in 2023 so far, and the index has spent much of this period higher than where it started the year.

At least one top strategist has abandoned his call for an early sell-off. Here’s Goldman Sachs’ David Kostin in a Feb. 3 note to clients (emphasis added):

Recent macro developments have strengthened our economists’ confidence in a soft landing and reduced equity downside risk in the near term. Outside the US, the growth picture in China has brightened following an earlier-than-expected reopening and Europe is now on track to avoid a recession following a warmer-than-expected winter. In addition, Fed Chair Powell this week did little to push back on the easing of financial conditions. Our rates strategists’ expected path of Treasuries suggest little near-term upside to yields. We therefore believe the risk of a substantial drawdown in the near term has diminished, barring unforeseen data surprises. We raise our 3-month S&P 500 price target to 4,000 (-3{21df340e03e388cc75c411746d1a214f72c176b221768b7ada42b4d751988996} from today) from 3,600. As shown this week, still-light institutional investor positioning points to the risk of a chase that would see the market temporarily overshoot our S&P 500 target of 4,000.

Most of the S&P 500 have announced quarterly financial results in recent weeks, and based on what they’ve revealed, it looks like the outlook for earnings may not be as grim as previously anticipated.

“[W]e see no recession ahead in the broad economy — or in earnings — but a soft landing,” Ed Yardeni, president of Yardeni Research, said on Tuesday (h/t Carl Quintanilla). “We are currently estimating that S&P 500 operating earnings will be up 4.7{21df340e03e388cc75c411746d1a214f72c176b221768b7ada42b4d751988996} this year to $225 per share and 11.1{21df340e03e388cc75c411746d1a214f72c176b221768b7ada42b4d751988996} next year to $250.”

S&P 500 earnings are expected to grow in 2023 and 2024. (Source: Yardeni Research via <a data-i13n="cpos:1;pos:1" href="https://twitter.com/carlquintanilla/status/1622909989697339398/photo/1" rel="nofollow noopener" target="_blank" data-ylk="slk:@CarlQuintanilla;cpos:1;pos:1" class="link ">@CarlQuintanilla</a>)
S&P 500 earnings are expected to grow in 2023 and 2024. (Source: Yardeni Research via @CarlQuintanilla)

The S&P 500 is currently trading above most strategists’ year-end target for the index. Should these gains hold and perhaps improve, we could soon see some strategists revise up their targets.

For more, read: Wall Street’s 2023 outlook for stocks 🔭, Stocks often rise in years when earnings fall 🤯, One of the most frequently cited risks to stocks in 2023 is ‘overstated’ 😑, and Everyone’s talking about a near-term sell-off. A contrarian signal?

What to make of all this

Not everyone thinks resilient economic growth is unambiguously good news.

“With very strong job growth, a higher labor force participation rate, and a decline in the unemployment rate to the lowest level since 1969, it is beginning to look more like a ‘no landing’ scenario,” Apollo’s Torsten Slok wrote in a February 4 note. “Under the no landing scenario the economy does not slow down, and upside risks to inflation are coming back after the initial decline in inflation driven by supply chain improvements.”

Renewed concerns about inflation could force the Fed to get more hawkish, which puts economic growth and rising stock prices at risk. In other words, good news could become bad news once again. For more on this dynamic, read: Your guide to ‘good news is bad news’ and ‘bad news is good news’ 🙃.

But if there’s one thing we’ve learned in recent months, it’s that we can simultaneously have consecutive months of healthy job growth and inflation readings that come in cool. For more on this dynamic, read: The bullish ‘goldilocks’ soft landing scenario that everyone wants 😀.

As always, time will tell what actually happens. But for the time being, the optimists appear to be triumphing over the pessimists as inflation, economic growth, and stock prices have been trending favorably in recent months.

More from TKer:

Share

That’s interesting! 💡

Did you know cricket is the second most watched sport in the world? And it’s emerging in the U.S. in a big way. From JohnWallStreet:

American Cricket Enterprises (ACE), the entity operating Major League Cricket (MLC), has raised more than $100 million. ACE founders Sameer Mehta, Vijay Srinivasan, Satyan Gajwani and Vineet Jain — and the balance of company investors — are betting the league will be able to draw the sport’s top players and attract interest from fans around the globe, becoming a staple of the cricket calendar in the process. If it can, club valuations will “grow like a hockey stick,” Sanjay Govil (chairman, Infinite Computer Solutions and CEO, Zyter Inc.) said. Govil owns the team in Washington D.C. Dallas, San Francisco, Los Angeles, New York City and Seattle will also have clubs playing in the inaugural ’23 season, which is slated to take place from June 13-30.

Reviewing the macro crosscurrents 🔀

There were a few notable data points from last week to consider:

⛓️ Supply chains continue to improve. The New York Fed’s Global Supply Chain Pressure Index

2

— a composite of various supply chain indicators — fell in January and is hovering at levels seen in late 2020. It’s way down from its December 2021 supply chain crisis high.

(Source: <a data-i13n="cpos:1;pos:1" href="https://www.newyorkfed.org/research/policy/gscpi#/interactive" rel="nofollow noopener" target="_blank" data-ylk="slk:NY Fed;cpos:1;pos:1" class="link ">NY Fed</a>)

📈 Inventory levels are up. According to Census Bureau data released Tuesday, wholesale inventories climbed 0.1{21df340e03e388cc75c411746d1a214f72c176b221768b7ada42b4d751988996} to $932.9 billion in December. The inventories/sales ratio was 1.36, up significantly from 1.24 the previous year.

For more on supply chains and inventory levels, read: “We can stop calling it a supply chain crisis ⛓,“ “9 reasons to be optimistic about the economy and markets 💪, “and “The bullish ‘goldilocks’ soft landing scenario that everyone wants 😀.

👍 Consumer sentiment is improving. From the University of Michigan February Survey of Consumers: “After three consecutive months of increases, sentiment is now 6{21df340e03e388cc75c411746d1a214f72c176b221768b7ada42b4d751988996} above a year ago but still 14{21df340e03e388cc75c411746d1a214f72c176b221768b7ada42b4d751988996} below two years ago, prior to the current inflationary episode. Overall, high prices continue to weigh on consumers despite the recent moderation in inflation, and sentiment remains more than 22{21df340e03e388cc75c411746d1a214f72c176b221768b7ada42b4d751988996} below its historical average since 1978.“

(Source: University of Michigan via <a data-i13n="cpos:1;pos:1" href="https://twitter.com/M_McDonough/status/1624062147427794944/" rel="nofollow noopener" target="_blank" data-ylk="slk:@M_McDonough;cpos:1;pos:1" class="link ">@M_McDonough</a>)

🛍️ Consumers are spending. From BofA: “We saw signs of strengthening in consumer spending in both retail and services in January, accelerating from December. Total Bank of America credit and debit card spending per household was up 5.1{21df340e03e388cc75c411746d1a214f72c176b221768b7ada42b4d751988996} YoY in January, vs. 2.2{21df340e03e388cc75c411746d1a214f72c176b221768b7ada42b4d751988996} YoY in December. On a month-over-month (MoM) seasonally adjusted (SA) basis, total card spending per household was up 1.7{21df340e03e388cc75c411746d1a214f72c176b221768b7ada42b4d751988996}, more than reversing the 1.4{21df340e03e388cc75c411746d1a214f72c176b221768b7ada42b4d751988996} MoM decline in December.“

(Source: <a data-i13n="cpos:1;pos:1" href="https://business.bofa.com/content/dam/flagship/bank-of-america-institute/economic-insights/consumer-checkpoint-february-2023.pdf" rel="nofollow noopener" target="_blank" data-ylk="slk:BofA;cpos:1;pos:1" class="link ">BofA</a>)

🍻 They’re buying cheap beer. From FreightWaves’ Rachel Premack: “…Beer became suddenly pricey at the end of last year. Beer prices at retail, which doesn’t include bars or restaurants, popped 7{21df340e03e388cc75c411746d1a214f72c176b221768b7ada42b4d751988996} during the last 13 weeks of 2022… That price increase is showing up in how people are buying brews, said Dave Williams, vice president of Bump Williams Consulting. People are increasingly buying, say, 12-packs over 30-packs or even single servings of beer. They’re trading down too — snagging the more economic Keystone over comparatively pricey Coors. That explains why the “below premium” segment was the only one to see an increase in demand in January compared to January 2022, according to the National Beer Wholesalers Association’s Beer Purchasers’ Index…”

(Source: <a data-i13n="cpos:1;pos:1" href="https://www.freightwaves.com/news/what-crappy-beer-demand-tells-us-about-the-economy" rel="nofollow noopener" target="_blank" data-ylk="slk:FreightWaves;cpos:1;pos:1" class="link ">FreightWaves</a>)

💳 Consumers are taking on more debt, but levels are manageable. According to Federal Reserve data, total revolving consumer credit outstanding increased to $1.196 trillion in December. Revolving credit consists mostly of credit card loans.

(Source: Federal Reserve via <a data-i13n="cpos:1;pos:1" href="https://fred.stlouisfed.org/series/REVOLSL#" rel="nofollow noopener" target="_blank" data-ylk="slk:FRED;cpos:1;pos:1" class="link ">FRED</a>)
(Source: Federal Reserve via FRED)

While the aggregate borrowing seems high, they’re much more reasonable when you look at consumer finances more holistically. From BofA: “On the savings side, Bank of America internal data suggests median household savings and checking balances across income groups have been trending down since April 2022, with the lowest income group (<$50k) seeing the steepest drawdown. But deposits remain above 2019 levels (Exhibit 6) for all income cohorts.“

(Source: <a data-i13n="cpos:1;pos:1" href="https://business.bofa.com/content/dam/flagship/bank-of-america-institute/economic-insights/consumer-checkpoint-february-2023.pdf" rel="nofollow noopener" target="_blank" data-ylk="slk:BofA;cpos:1;pos:1" class="link ">BofA</a>)

💳 No, they are not maxing out their credit cards. From BofA: “Lower income consumers appear to still have some level of comfort in terms of their financial constraints. On the one hand, the ratio of median household card spending to median deposit balances (spending-to-savings ratio) remained lower than in 2019 for households with an annual income of less than <$150k (Exhibit 7). This suggests this cohort’s spending would not need to be reduced too much for the spending-to-savings ratio to return to 2019 levels. On the other hand, the Bank of America credit card utilization rate also remained lower than in 2019 across income groups (Exhibit 8).“

(Source: <a data-i13n="cpos:1;pos:1" href="https://business.bofa.com/content/dam/flagship/bank-of-america-institute/economic-insights/consumer-checkpoint-february-2023.pdf" rel="nofollow noopener" target="_blank" data-ylk="slk:BofA;cpos:1;pos:1" class="link ">BofA</a>)

For more on this, read: Consumer finances are in remarkably good shape 💰

💵 Consumers are getting more on their savings accounts. From Semafor’s Liz Hoffman: “The average savings account rate has quintupled since last January to 0.33{21df340e03e388cc75c411746d1a214f72c176b221768b7ada42b4d751988996}, according to data from the U.S. Federal Deposit Insurance Corporation…“

(Source: <a data-i13n="cpos:1;pos:1" href="https://www.semafor.com/newsletter/02/09/2023/national-security-worries-force-forbes-to-look-for-a-us-investor" rel="nofollow noopener" target="_blank" data-ylk="slk:Semafor;cpos:1;pos:1" class="link ">Semafor</a>)

🤔 Low union participation helps explain low wage growth. From UBS: ““Wage growth is slowing noticeably along multiple measures even with a decades low unemployment rate. Why? … One reason could be low bargaining power for workers… The share of unionized workers among private employees fell to 6{21df340e03e388cc75c411746d1a214f72c176b221768b7ada42b4d751988996} in 2022, according to the BLS.”

💰 Wall Street is busy. From Bloomberg on Tuesday: “About seven IPOs are expected to raise a combined $900 million and begin trading by Friday [Feb. 10], making for the busiest week since October’s $990 million listing by Intel Corp.’s self-driving technology unit Mobileye Global Inc., according to data compiled by Bloomberg. [Last] week’s debuts include solar power equipment maker Nextracker Inc., which plans to raise as much as $535 million in what would be the year’s biggest deal yet. Enlight Renewable Energy Ltd., which is already public in Israel, plans to add a listing on the Nasdaq.“

(Source: <a data-i13n="cpos:1;pos:1" href="https://www.bloomberg.com/news/articles/2023-02-07/ipo-market-warms-up-with-busiest-us-trading-week-since-october" rel="nofollow noopener" target="_blank" data-ylk="slk:Bloomberg;cpos:1;pos:1" class="link ">Bloomberg</a>)

And it’s not just IPOs. There were numerous reports of dealmaking activity last week involving some big names (link).

(via <a data-i13n="cpos:1;pos:1" href="https://twitter.com/SamRo/status/1622907207896469505" rel="nofollow noopener" target="_blank" data-ylk="slk:@SamRo;cpos:1;pos:1" class="link ">@SamRo</a>)

📉 👎 Big companies announce layoffs. On Monday, Bloomberg reported that Dell Technologies would be “eliminating about 6,650.“ On Tuesday, Zoom announced it would “say goodbye to around 1,300 hardworking, talented colleagues.“ On Wednesday, Disney announced it would be “reducing our workforce by approximately 7,000 jobs.“ On Thursday, News Corp announced “an expected 5{21df340e03e388cc75c411746d1a214f72c176b221768b7ada42b4d751988996} headcount reduction, or around 1,250 positions,” and Axios reported that Yahoo would lay off “more than 1,600 people.”

Here’s UBS economist Paul Donovan offering some perspective: “Another company—Disney this time — has announced headcount reductions. We get US initial jobless claims data [Thursday], and the macroeconomic data does not match the high profile press releases of job losses. A major reason is that large companies are not that important economically — smaller businesses matter most to labor markets. Smaller businesses tend to have underemployment rather than unemployment. It is quite hard to fire 10{21df340e03e388cc75c411746d1a214f72c176b221768b7ada42b4d751988996} of a three-person company.“

For more on this, read: Making sense of conflicting news on the labor market 🤔.

⚠️ More big layoff announcements to come? Goldman Sachs economists think it’s possible. From a research note published Monday: “…on the negative side, there could be additional layoff announcements yet to come from other large companies, as roughly 15{21df340e03e388cc75c411746d1a214f72c176b221768b7ada42b4d751988996} of companies in the S&P 500 have seen headcount increases of 40{21df340e03e388cc75c411746d1a214f72c176b221768b7ada42b4d751988996} or more since the start of the pandemic (Exhibit 4), and only one-fifth of them have announced layoffs so far.“

(Source: Goldman Sachs)

(Source: Goldman Sachs)

But: “…on the positive side, similar to the rebalancing seen so far in the broader labor market, even these companies that have announced layoffs have reduced their total demand for workers overwhelmingly by reducing job openings rather than by conducting layoffs.“ For more on job openings, read: How job openings explain everything in the economy and the markets right now 📋.

Also: “…Exhibit 7 shows that most industries (8 out of 11) have reemployment rates above pre-pandemic levels, including the information sector (the sector of most major tech companies), and that all of them have reemployment rates that are above the recent expansion average.”

(Source: Goldman Sachs)

(Source: Goldman Sachs)

I’ve started an informal thread on Twitter tracking anecdotes of companies hiring (Link).

For more on hiring, read: That’s a lot of hiring 🍾 and You should not be surprised by the strength of the labor market 💪.

💼 Unemployment claims remain low. Initial claims for unemployment benefits climbed to 196,000 during the week ending Feb. 4, up from 183,000 the week prior. While the number is up from its six-decade low of 166,000 in March, it remains near levels seen during periods of economic expansion.

(Source: DOL via <a data-i13n="cpos:1;pos:1" href="https://fred.stlouisfed.org/series/ICSA#" rel="nofollow noopener" target="_blank" data-ylk="slk:FRED;cpos:1;pos:1" class="link ">FRED</a>)

For more on low unemployment, read: 9 reasons to be optimistic about the economy and markets 💪.

🏠 On work from home #WFH. From Stanford professor Nick Bloom: “Data on 4,000 U.S. firms #WFH policies: 1) 50{21df340e03e388cc75c411746d1a214f72c176b221768b7ada42b4d751988996} of firms are fully on-site, like food-service, accommodation and retail, 2) 40{21df340e03e388cc75c411746d1a214f72c176b221768b7ada42b4d751988996} combine #WFH and in person days in various ways: min-days, anchor days, employee choice etc, 3) 8{21df340e03e388cc75c411746d1a214f72c176b221768b7ada42b4d751988996} are fully remote“

(Source: <a data-i13n="cpos:1;pos:1" href="https://twitter.com/I_Am_NickBloom/status/1622910542485549057/" rel="nofollow noopener" target="_blank" data-ylk="slk:@I_Am_NickBloom;cpos:1;pos:1" class="link ">@I_Am_NickBloom</a>)

Putting it all together 🤔

We’re getting a lot of evidence that we may get the bullish “Goldilocks” soft landing scenario where inflation cools to manageable levels without the economy having to sink into recession.

And the Federal Reserve has recently adopted a less hawkish tone, acknowledging on February 1 that “for the first time that the disinflationary process has started.“

Nevertheless, inflation still has to come down more before the Fed is comfortable with price levels. So we should expect the central bank to continue to tighten monetary policy, which means we should be prepared for tighter financial conditions (e.g. higher interest rates, tighter lending standards, and lower stock valuations). All of this means the market beatings may continue and the risk the economy sinks into a recession will be elevated.

It’s important to remember that while recession risks are elevated, consumers are coming from a very strong financial position. Unemployed people are getting jobs. Those with jobs are getting raises. And many still have excess savings to tap into. Indeed, strong spending data confirms this financial resilience. So it’s too early to sound the alarm from a consumption perspective.

At this point, any downturn is unlikely to turn into economic calamity given that the financial health of consumers and businesses remains very strong.

As always, long-term investors should remember that recessions and bear markets are just part of the deal when you enter the stock market with the aim of generating long-term returns. While markets have had a terrible year, the long-run outlook for stocks remains positive.

For more on how the macro story is evolving, check out the previous TKer macro crosscurrents »

For more on why this is an unusually unfavorable environment for the stock market, read: The market beatings will continue until inflation improves 🥊 »

For a closer look at where we are and how we got here, read: The complicated mess of the markets and economy, explained 🧩 »

This post was originally published on TKer.co

Sam Ro is the founder of TKer.co. Follow him on Twitter at @SamRo

Click here for the latest stock market news and in-depth analysis, including events that move stocks

Read the latest financial and business news from Yahoo Finance

Download the Yahoo Finance app for Apple or Android

Follow Yahoo Finance on Twitter, Facebook, Instagram, Flipboard, LinkedIn, and YouTube
Financial Market Conditions during Monetary Tightening

Financial Market Conditions during Monetary Tightening

Simon H. Kwan and Louis Liu

The current round of federal funds rate increases is expected to reverse a historically large gap between the real funds rate and the neutral rate at the beginning of the tightening cycle. Financial markets have reacted faster and more strongly than in past monetary tightening cycles, in part because of this large gap and the Federal Reserve’s forward guidance. Historical experiences suggest financial conditions could tighten even more given the size of the gap.


Financial markets play a central role in how business cycles fluctuate and spread through the U.S. economy. As monetary policy works through various transmission channels to impact real economic activity, financial market channels are first and foremost in determining both the speed and the extent of policy transmission (Bernanke, Gertler, and Gilchrist 1999). Thus, understanding how much financial conditions have tightened provides important feedback for calibrating monetary policy.

In past monetary tightening episodes, the degree of tightening in overall financial conditions depended on how much and how long monetary tightening continued, as well as prevailing economic conditions when tightening began. Specifically, the extent of monetary tightening depends on inflationary pressures and how strong the economy is when tightening starts. In past cycles, federal funds rate increases ranged from about 1 percentage point (1965–66) to over 10 percentage points (1977–80).

This Economic Letter compares the size and the speed of financial market responses between current and past cycles of monetary tightening. We focus on analyzing long-term interest rates, stock prices, and credit spreads because they directly affect the cost of capital and thus real economic activity. Since the current tightening cycle is likely still ongoing, the financial market response could still change substantially. Nevertheless, comparing current financial market changes to those during previous tightening cycles sheds light on the speed of adjustment.

Monetary tightening cycles

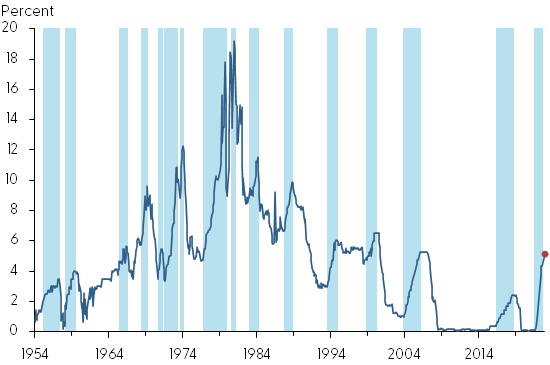
Figure 1 shows the 15 postwar monetary tightening cycles. The first 11 cycles are identified following the methodology in Adrian and Estrella (2008). This assumes that a tightening cycle starts when the federal funds rate rises by 0.25 percentage point (25 basis points) or more in two consecutive months. A tightening cycle ends when either (1) the federal funds rate is higher than at any time from 12 months before to 9 months after and is at least 0.5 percentage point higher than at the beginning of this period, or (2) the federal funds rate is higher than at any time from 6 months before to 6 months after and is 1.5 percentage points higher than the average at these end points.

Figure 1
Effective federal funds rate

Effective federal funds rate

Source: Federal Reserve Board of Governors and authors’ calculations.

Note: Blue shading indicates periods of monetary policy tightening as described in text.

Since the late 1990s, forward guidance became a prominent monetary policy tool (Bernanke 2020). We therefore identify the tightening cycles based on the Federal Open Market Committee (FOMC) communications, as financial markets are always forward looking. For example, forward-looking language first appeared in the post-meeting FOMC press release in May 1999. Although the Committee decided not to raise rates at that meeting, the post-meeting press release signaled the FOMC’s bias toward the possibility of a firming in the stance of monetary policy. We therefore assume the 1999–2000 tightening cycle started in May, even though the policy rate did not increase until June.

For the current tightening cycle, the Committee expected after its January 2022 meeting that “it will soon be appropriate to raise the target range for the federal funds rate.” In the December 2022 FOMC Summary of Economic Projections (SEP), the median projection of the federal funds rate for 2023 by FOMC participants was 5.1{21df340e03e388cc75c411746d1a214f72c176b221768b7ada42b4d751988996}, compared to 4.4{21df340e03e388cc75c411746d1a214f72c176b221768b7ada42b4d751988996} for 2022. In this Letter, we make the straightforward assumption that the federal funds rate will reach 5.1{21df340e03e388cc75c411746d1a214f72c176b221768b7ada42b4d751988996} about the middle of this year, based on the contour of the federal funds futures. Hence, the current tightening cycle is assumed to last from January 2022 to May 2023, lifting the federal funds rate from 0.08{21df340e03e388cc75c411746d1a214f72c176b221768b7ada42b4d751988996} to 5.1{21df340e03e388cc75c411746d1a214f72c176b221768b7ada42b4d751988996}.

The federal funds rate

Each tightening cycle has been unique in terms of the duration and the change in the federal funds rate. Not all tightening cycles have been followed by recessions. The median increase in the federal funds rate in past tightening cycles was 2.57 percentage points, and the median pace of tightening was 0.20 percentage point per month. For the current cycle, based on the SEP projections, the expected tightening is 5.02 percentage points at an average pace of 0.31 percentage point per month, both of which are well above the median.

To control for monetary conditions at the onset of tightening, we compute the real funds rate gap by subtracting the inflation rate and the real neutral rate from the nominal federal funds rate. The smaller or more negative the real funds rate gap is, the more monetary accommodation is in the economy. We use the past 12-month change in the consumer price index (CPI) to measure the inflation rate. Although current CPI inflation is an imperfect proxy for expected inflation, the Survey of Professional Forecasters’ expected one-year-ahead inflation rate, which did not start until 1980, provides qualitatively similar results for the last six tightening cycles. We use the real neutral rate estimated by Laubach and Williams (2003). For the current cycle, we use a real neutral rate of 0.5{21df340e03e388cc75c411746d1a214f72c176b221768b7ada42b4d751988996}, which is the difference between the median long-run funds rate of 2.5{21df340e03e388cc75c411746d1a214f72c176b221768b7ada42b4d751988996} from the December SEP and the 2{21df340e03e388cc75c411746d1a214f72c176b221768b7ada42b4d751988996} target inflation rate.

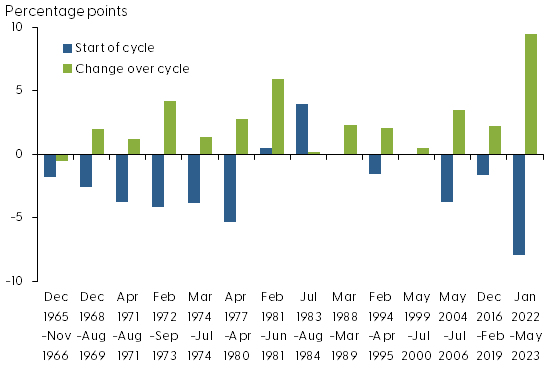
Figure 2 shows the real funds rate gap (blue bars) at the beginning of each tightening cycle. The real funds rate gap of –7.9{21df340e03e388cc75c411746d1a214f72c176b221768b7ada42b4d751988996} at the beginning of the current cycle is the largest among all tightening cycles, in part due to high inflation. Figure 2 also shows the difference in the real funds rate gap between the end and the beginning of each tightening cycle—which reflects how much the gap was closed (green bars). Assuming the inflation rate at the end of the current tightening cycle will be 3.1{21df340e03e388cc75c411746d1a214f72c176b221768b7ada42b4d751988996} based on the December SEP, the real funds rate gap at the end of the current cycle would be 1.5{21df340e03e388cc75c411746d1a214f72c176b221768b7ada42b4d751988996}. If the Fed successfully closes the funds rate gap by 9.4{21df340e03e388cc75c411746d1a214f72c176b221768b7ada42b4d751988996} by the end of the current cycle—through both raising the interest rate and bringing down inflation—it would be the largest gap closure on record.

Figure 2
Real funds rate gap: Initial levels and changes over cycle

Real funds rate gap: Initial levels and changes over cycle

Source: Laubach and Williams (2003), Bureau of Labor Statistics, Federal Reserve Board of Governors and authors’ calculations.

Note: Last cycle includes assumptions based on December 2022 SEP projections.

Long-term rates and stock prices

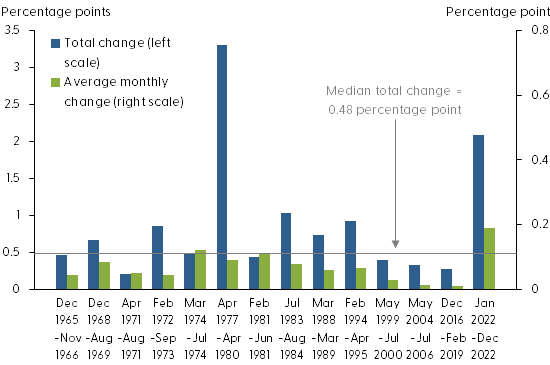
The current increase in the 10-year Treasury rate is the second largest increase of all tightening cycles, shown by the blue bars in Figure 3. Moreover, the green bars show that the speed of this increase has been unprecedented. Research shows that the response of asset prices to anticipated monetary policy changes is essentially zero, while their response to unanticipated movements is large and highly significant (Kuttner 2000). Thus, before forward guidance, each monetary policy tightening may have contained unanticipated information that had not been fully incorporated into asset prices; therefore, without advance communication, financial markets would have reacted to each tightening until the cycle ended.

Figure 3
Percentage point changes in 10-year Treasury yield

Percentage point changes in 10-year Treasury yield

Source: Federal Reserve Board of Governors and authors’ calculations.

With forward guidance, market participants can form expectations about tightening cycles, including the expected duration and amount of tightening. Because the expected tightening is fully incorporated into asset prices well before the completion of the tightening cycle, this partially explains the speed of the increase in long-term rates in the current cycle.

A widely held view by economists is that long-term interest rates tend to have relatively bigger effects on real economic activities than short-term rates. This is in part due to the large share of long-term debt contracts with a fixed interest rate in our financial system, including fixed-rate mortgages, term loans, and corporate bonds, whose rates are often tied to long-term Treasury rates. Thus, the rapid increase in long-term rates would cool the economy relatively faster than in previous cycles.

The contract interest rate above the Treasury rate, known as the spread, is another determinant of financial conditions. The spread reflects the risk premium demanded by the lender in providing debt financing to risky borrowers. In past tightening cycles, bond spreads haven’t always tightened, and the median change in the benchmark Baa bond spread was close to zero. Currently, the Baa spread has widened only about 0.06 percentage point, which is small relative to the large increase in the long-term Treasury rate.

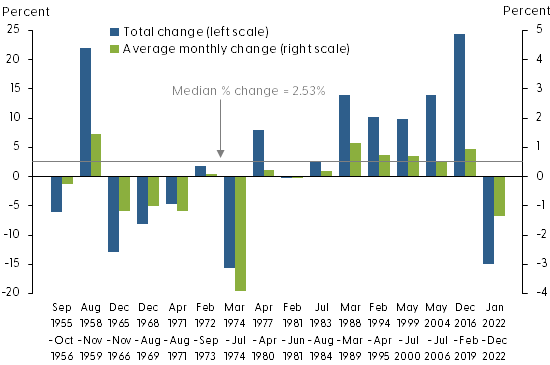
In previous tightening episodes, stock prices initially fell but sometimes rebounded to end the tightening cycle with a net gain. Figure 4 shows that stock prices declined on net in five of the past 15 tightening episodes. The median change in the Standard & Poor’s 500 in previous cycles was +2.53{21df340e03e388cc75c411746d1a214f72c176b221768b7ada42b4d751988996}. Both the current decline in stock prices and the speed of the decline, as measured by the average monthly change in stock prices, are large relative to the historical average. Stock valuations, such as the price-to-earnings ratio, exhibit similar patterns.

Figure 4
Percent changes in Standard & Poor’s 500

Percent changes in Standard & Poor’s 500

Source: Bloomberg, Federal Reserve Board of Governors and authors’ calculations.

Comparing the current changes in bond rates and stock prices to those in previous completed tightening cycles that lasted longer reflects the notion that forward guidance has front-loaded the financial market response in the current cycle. This is consistent with the stance of monetary policy being tighter than what is implied by the federal funds rate (Choi et al. 2022). Repeating the analysis to control for cycle duration yields qualitatively similar results.

Insights from the past

What can we learn from history to understand how financial conditions could play out through the end of this tightening cycle? The historical relation between monetary conditions at the onset of tightening cycles and tightening in interest rates and stock prices may provide some clues. Regressing the real funds rate gap on the change in the federal funds rate yields a significantly negative relationship: a more negative real funds rate gap tends to be followed by a bigger increase in the federal funds rate. Given the large negative real funds rate gap in the current cycle, history suggests that the total increase in the federal funds rate could be bigger than expected.

Regressing the real funds rate gap on the change in stock prices yields a significantly positive relationship, implying that the more negative the real funds rate gap, the larger the decline in stock prices during a tightening cycle. When we use this historical relationship to evaluate stock prices at the large negative funds rate gap, stock prices are projected to decline further. The historical relationship between the funds rate gap and bond spreads also calls for more tightening in the bond market. Taken together, with the historically large funds rate gap at the onset of the current cycle, past experiences indicate that more tightening of financial conditions could follow.

Conclusions

Current increases in the federal funds rate are expected to reverse a historically large negative real funds rate gap at the beginning of the cycle. Successfully closing the real funds rate gap will hinge on substantially reducing the inflation rate. Relative to history, both the size and the speed of tightening in Treasury bonds and common stocks have been large in the current cycle, in part because of the large gap and the Federal Reserve’s forward guidance. While the rapid tightening of financial conditions is expected to slow the economy relatively quickly, historical experiences raise the possibility of even more tightening in financial conditions given the large real rate gap that needs to be closed.

Simon H. Kwan

Senior Research Advisor, Economic Research Department, Federal Reserve Bank of San Francisco

Louis Liu

Research Associate, Economic Research Department, Federal Reserve Bank of San Francisco

References

Adrian, Tobias, and Arturo Estrella. 2008. “Monetary Tightening Cycles and the Predictability of Economic Activity.” Economics Letters 99(2), pp. 260–264.

Bernanke, Ben S. 2020. “The New Tools of Monetary Policy.” American Economic Review 110(4, April), pp. 943–983.

Bernanke, Ben S., Mark Gertler, and Simon Gilchrist. 1999. “The Financial Accelerator in a Quantitative Business Cycle Framework.” Chapter 21 in Handbook of Macroeconomics 1, part C, eds. J.B. Taylor and M. Woodford. Amsterdam: Elsevier, pp. 1,341–1,393.

Choi, Jason, Taeyoung Doh, Andrew Foerster, and Zinnia Martinez. 2022. “Monetary Policy Stance Is Tighter than Federal Funds Rate.” FRBSF Economic Letter 2022-30 (November 7).

Kuttner, Kenneth N. 2001. “Monetary Policy Surprises and Interest Rates: Evidence from the Fed Funds Futures Market.” Journal of Monetary Economics 47(3, June), pp. 523–544.

Laubach, Thomas, and John C. Williams. 2003. “Measuring the Natural Rate of Interest.” Review of Economics and Statistics 85(4, November), pp. 1,063–1,070.

New Research on the Impact of Modern Monetary Policy on Equity Markets During the Covid-19 Pandemic Wins 2022 Graham and Dodd Award of Excellence

New Research on the Impact of Modern Monetary Policy on Equity Markets During the Covid-19 Pandemic Wins 2022 Graham and Dodd Award of Excellence

Released in the Money Analysts Journal, the successful exploration addresses the substantial impact of the most intense unconventional US financial coverage on report.

NEW YORK, Jan. 23, 2023 /PRNewswire/ — CFA Institute, the world wide association of expenditure pros, announces the winners of the 2022 Graham and Dodd Awards of Excellence. These prestigious awards are bestowed per year for the most effective investigate articles released in the Money Analysts Journal, the flagship publication of CFA Institute, and understand the contribution of the content articles to the exercise of investment decision administration. The awards are named in honor of Benjamin Graham and David L. Dodd for their enduring contributions to the industry of investment assessment.

The 2022 winner of the Graham and Dodd Major Award is Free Marketplaces to Fed Marketplaces: How Contemporary Monetary Coverage Impacts Equity Markets, Economical Analysts Journal, by Tālis J. Putniņš, Professor of Finance at the College Engineering of Sydney and the Stockholm School of Economics in Riga.

The analysis addresses the considerable influence of the most aggressive US financial policy on history when the Federal Reserve (the Fed) doubled its balance sheet throughout the COVID-19 pandemic. The investigate discovers a solid relationship involving the Fed’s harmony sheet and inventory current market price ranges it finds that the Fed responds far more strongly (by way of its asset buys) to negative stock industry returns, whilst the inventory industry is additional sensitive to the Fed’s equilibrium sheet contractions than it is to equilibrium sheet expansions. The investigation finds that the timing of the current market reactions counsel that the stock market place mainly responds to understood harmony-sheet improvements, as opposed to announcement consequences that would imply an earlier response. Even more, the Fed’s stability sheet expansion for the duration of COVID-19 describes at least just one-3rd of the stock market’s rebound subsequent its crash in March 2020.

The investigation will aid asset supervisors product the steps of the Fed to superior realize the effects of present-day monetary plan on portfolio threat and return. The writer exhibits that, specially in instances of macroeconomic dislocation, the bilateral feedback between asset markets and monetary authorities is of very first-order importance to traders and policymakers.

The 2022 winner of the Graham and Dodd Scroll Award is Which Company ESG News Does the Market Respond To?, Economical Analysts Journal, by George Serafeim and Aaron Yoon. Professor Serafeim is the Charles M. Williams Professor of Company Administration at Harvard Enterprise School wherever he co-potential customers the Weather and Sustainability Influence AI Lab Professor Yoon is Assistant Professor of Accounting and Facts Administration at Northwestern University – Kellogg Faculty of Management.

The article analyzes a special dataset that creates an ESG information sentiment rating by tracking everyday ESG information throughout additional than 3,000 firms and examines no matter whether and how traders react to the launch of distinctive ESG-connected info. The study located that prices react only to marketplace-unique economically product ESG information, and that the cost response is more substantial for ESG news that is optimistic, has obtained more news protection, and is connected to social money challenges.

Margaret Franklin, CFA, President and CEO, CFA Institute, responses:

“For a lot more than 60 many years, the Graham and Dodd Awards have regarded a decide on amount of Money Analyst Journal articles for their excellent contribution to the world-wide overall body of demanding and peer-reviewed expenditure investigation. I’m thrilled by the caliber of exploration that these annual awards carry on to surface area. These successful articles are a meaningful addition to our collective knowledge as market practitioners. I remarkably commend them to those who have a deep fascination and curiosity about the working of financial investment markets.”

William Goetzmann, Executive Editor of Fiscal Analysts Journal, feedback:

“The recipients of this year’s Graham and Dodd awards impressed the Economical Analysts Journal editorial group and panel of judges with investigation that is modern, actionable, perfectly-published, well timed, and of curiosity to both investment practitioners and academia. These is effective produce crucial info-abundant learnings and observations about marketplaces, trader conduct, and monetary coverage, during a single of the most difficult financial periods in modern-day history.”

The study articles or blog posts for present and earlier winners can be accessed right here.

For further facts, remember to make contact with pr@cfainstitute.org.

Notes to Editors

About the Graham and Dodd Awards of Excellence
The Graham and Dodd Awards of Excellence comprise a Top Award for the most effective write-up and up to two Scroll Awards. Winners are picked out by a two-phase range approach: Initially, all customers of the Economic Analysts Journal Editorial Board and Advisory Council are invited to vote, making a shortlist of exploration articles or blog posts released in the Economical Analysts Journal throughout the calendar year. Second, the Graham and Dodd Awards of Excellence operating team, assembled from the CFA Institute leadership, Board of Governors, and Monetary Analysts Journal editorial workforce, collectively decides the award winners from the shortlist.

About the Fiscal Analysts Journal
The CFA Institute Economic Analyst Journal is the top practitioner journal for the investment administration community. Considering the fact that its founding in 1945, the journal has innovative the understanding and comprehending of the practice of investment administration as a result of the publication of peer-reviewed and practitioner-related investigate. The Financial Analysts Journal is released 4 times for each 12 months and is a gain of CFA Institute membership, which contains more than 190,000 CFA charterholders serving in roles which include expense management, exploration, and consulting. Much more than 3,200 economical establishments and university libraries all over the world have membership access. The Taylor & Francis Press Go gives journalists with no cost access to Fiscal Analyst Journal content articles.

About CFA Institute
CFA Institute is the global association of expense industry experts that sets the standard for professional excellence and qualifications. The organization is a champion of moral conduct in investment marketplaces and a highly regarded supply of expertise in the world-wide money group. Our goal is to develop an ecosystem wherever investors’ interests appear initially, marketplaces perform at their ideal, and economies mature. There are much more than 190,000 CFA charterholders worldwide in 160 marketplaces. CFA Institute has nine places of work throughout the world and 160 regional societies. For far more details, pay a visit to www.cfainstitute.org or comply with us on Linkedin and Twitter at @CFAInstitute.

Cision

Cision

See first written content:https://www.prnewswire.com/news-releases/new-investigation-on-the-effects-of-modern-day-financial-plan-on-fairness-markets-all through-the-covid-19-pandemic-wins-2022-graham-and-dodd-award-of-excellence-301727687.html

Resource CFA Institute

Monetary policy must serve the real economy not just financial markets

Monetary policy must serve the real economy not just financial markets

Forget all the fancy discuss about neutral desire premiums and output gaps. The two fundamental concerns experiencing the Federal Reserve are uncomplicated to condition and sophisticated to answer: is the world’s most potent central bank at last committed to return monetary policy to serving the authentic financial state somewhat than economic markets and can it do so in an orderly vogue?

These issues are nonetheless to be adequately grasped by marketplaces, and for very good explanation. Viewed from their standpoint, the threat for the Fed of not pursuing the market’s lead is also highly-priced. However, even if they are ultimately appropriate, marketplaces will extremely probably obtain them selves with substantially considerably less of an impact on financial policy than in latest moments.

The qualifications to the present-day scenario is nicely recognized. For too prolonged, monetary policy has been primarily co-opted by markets. The phenomenon begun innocently enough with central bankers’ wish to counter the problems that malfunctioning markets inflict on financial wellbeing. Alternatively than transpiring not often with very well-focused implementation, significant liquidity injections and floored fascination premiums created into a practice.

Above and in excess of yet again, the Fed felt compelled to use its impressive liquidity-generation weapons to counter asset rate declines, even when the chance of disorderly and unstable marketplaces was not evident. At moments, these “unconventional” measures had been constant with the desires of the genuine financial system. Much too frequently, nevertheless, they were not.

Like a child effectively throwing tantrums to get much more sweets, marketplaces arrived to expect looser fiscal ailments every time there was a powerful whiff of instability. This expectation developed into insistence. In change, the Fed went from just responding to industry volatility to also trying to pre-empt it.

Central bankers had been not blind to the harmful co-dependencies. The existing leaders of both of those the Fed and the European Central Financial institution, Jay Powell and Christine Lagarde, attempted early in their tenures to transform the dynamic. But they failed, and ended up compelled into uncomfortable U-turns that made markets sense even much more empowered and entitled to insist on the continuation of extremely-unfastened insurance policies.

Right now, even so, the two-decade-very long market place dominance about financial plan is threatened like by no means before by superior and persistent inflation.

Central banking companies have small selection but to relegate marketplace criteria in the confront of accelerating price tag improves that severely undermine specifications of dwelling, erode the potential progress outlook and strike most difficult the most susceptible segments of modern society.

The condition is notably acute for the Fed presented its gross mischaracterisation of inflation for most of past calendar year, collectively with its failure to act decisively when it belatedly recognised that rate instability had taken root under its observe.

But how best to do so is a difficulty, offered how a great deal the Fed’s delayed being familiar with and reaction have narrowed the pathway for orderly disinflation. That is, the trouble of lessening inflation without the need of unduly harming financial wellbeing has only amplified. For that, the central financial institution must have initiated the plan pivot a calendar year in the past.

If the Fed now validates the intense curiosity charge rises that markets foresee, starting off with a 50 basis issue raise when its major plan committee next satisfies on Could 3-4, it threats seeing them price tag in still a lot more tightening. The end result of this dynamic would be an even even larger plan oversight as the Fed pushes the financial system into a recession.

If, however, the central bank fails to validate market place pricing, it could erode its plan trustworthiness additional. This would undermine inflation expectations, causing the inflation challenge to persist very well into 2023 if not outside of.

The situation is made additional sophisticated by the chance that these two alternatives would consequence in a diploma of economical instability in the US and in other places. Even worse — and this may nicely be the most very likely final result — the Fed could flip-flop over the following 12 to 24 months from tightening to loosening and then tightening yet again.

The Fed may possibly characterise these flip-flopping as nimbleness but it would prolong stagflationary tendencies, weaken its institutional standing and fall short decisively to return financial policy to the company of the actual economic climate. And for all those in the markets that would deem this a victory, it would likely verify a fleeting 1 at finest.

The time has appear to return monetary policy to the service of the authentic financial state. It is a considerably from automated and easy course of action at this late phase. Yet the alternative of not executing so would be a lot far more problematic.

Irrelevance of January Fed Minutes Shows How Fast Monetary Policy Is Moving

Irrelevance of January Fed Minutes Shows How Fast Monetary Policy Is Moving

With minutes from the U.S. Federal Reserve’s January meeting owing out Wednesday, crypto traders could possibly be forgiven for dismissing them entirely.

Seem how dramatically the surroundings has improved in the previous thirty day period: The January positions report showed a substantially hotter labor industry than envisioned by economists, describing partly why last week’s Buyer Value Index report arrived in at a surprising 7.5{21df340e03e388cc75c411746d1a214f72c176b221768b7ada42b4d751988996}, larger than analysts predicted and the speediest speed in four decades.

The contemporary data set Wall Road on superior warn that problems have been turning into much more urgent even than Fed Chair Jerome Powell had telegraphed at the January conference. World-wide economic marketplaces reacted by pricing in a a great deal a lot more aggressive charge-hiking cycle by the Federal Reserve.

‘Inter-assembly charge hike’

At one particular issue final 7 days, speculation even mounted over a attainable “inter-conference charge hike” – the idea that the U.S. central bank could not pay for to wait right until its following standard assembly, scheduled for March, to begin elevating premiums. James Bullard, president of the Federal Reserve Lender of St. Louis, stated in an interview that “there was a time when you would just consider a circumstance like this and you would just meet today, off-cycle.”

Bullard’s statement crushed both stock and crypto markets, based mostly on problems that a far more intense Fed could send prices for risky belongings into a tailspin.

“If the Fed surprises marketplaces, the speed of this danger-off shift will accelerate, maybe considerably,” stated Federal Economical Analytics’ controlling partner Karen Petrou. “Cryptocurrency will put up with like all ‘risk-off’ sector sectors in this circumstance, but potentially experience even worse simply because its volatility is so significantly larger.”

Fears of an inter-assembly price hike by the Fed abated on Monday as U.S. limited-phrase interest amount futures implied just a 3{21df340e03e388cc75c411746d1a214f72c176b221768b7ada42b4d751988996} opportunity of fee hikes right before the upcoming two-day Federal Open Current market Committee (FOMC) conference in March, down from 30{21df340e03e388cc75c411746d1a214f72c176b221768b7ada42b4d751988996} just after Bullard’s job interview, in accordance to Reuters.

Wholesale price tag inflation

Having said that, the Labor Department’s most up-to-date Producer Value Index, which was released Tuesday, showed inflation in wholesale selling prices at a increased clip than expected by economists, reinforcing the circumstance for the Federal Reserve to raise fascination fees sooner alternatively than later on.

The Federal Reserve is scheduled to release minutes of its January assembly later on Wednesday and some analysts have prompt that the Fed could possibly actively request to promote off assets – somewhat than simply permitting the bonds roll off at maturity – to shrink the balance sheet even quicker.

“We assume this suggested passive reduction will be bullish for the market place,” QCP Money wrote in a concept.

Even so, just having a look at the CME’s FedWatch device more than the previous month presents an concept of how much expectations about the Fed minutes have improved considering that the previous meeting. The instrument displays the implied stage of potential Fed costs primarily based on charges from CME futures contracts.

Just one 7 days ago, traders put a 74{21df340e03e388cc75c411746d1a214f72c176b221768b7ada42b4d751988996} probability on a .25 proportion-position rate hike in March. On Tuesday, predictions reversed, with 58{21df340e03e388cc75c411746d1a214f72c176b221768b7ada42b4d751988996} of traders now betting on a 50 basis point hike.

“I’m not sure what we are going to master from the Fed minutes later on right now that we are not now knowledgeable of, with quite a few policymakers expressing more and more hawkish views in modern weeks,” Craig Erlam, senior market analyst at the foreign-exchange brokerage Oanda, wrote Wednesday in an e mail.

The unkind variety of shock

In standard, the Fed does not like to surprise traders, but no matter if a amount hike comes about at upcoming month’s policy meeting on March 16 or at a shock conference prior to, the crypto current market will probable be influenced negatively, according to some analysts.

“Given bitcoin and cryptocurrencies are continue to correlating considerably with chance sentiment, we see [a surprise hike] as getting a weighing affect,” stated Joel Kruger, crypto strategist at LMAX Electronic. “That currently being said, we hope any dips in bitcoin (crypto) would be really perfectly supported on its extended-phrase value proposition.”

Some analysts feel of bitcoin as a hedge from inflation on the other hand, new industry movements recommend that the volatility in the cryptocurrency market place is scaring buyers away. The marketplace has been on a downward path given that its series of all-time-highs in November, while inflation is even now on the rise.

“It would make sense that as we enter into a charge hike cycle, some of that underlying bid will be taken back again out of the industry,” Dan Gunsberg, co-founder and CEO of the Hxro Basis, claimed.This would seem really plausible in the brief run. Nonetheless, rates are not the only catalyst that drive value in bitcoin and other cryptocurrencies. Like most marketplaces, this is just a dominant narrative for the moment.”