Simon H. Kwan and Louis Liu
The current round of federal funds rate increases is expected to reverse a historically large gap between the real funds rate and the neutral rate at the beginning of the tightening cycle. Financial markets have reacted faster and more strongly than in past monetary tightening cycles, in part because of this large gap and the Federal Reserve’s forward guidance. Historical experiences suggest financial conditions could tighten even more given the size of the gap.
Financial markets play a central role in how business cycles fluctuate and spread through the U.S. economy. As monetary policy works through various transmission channels to impact real economic activity, financial market channels are first and foremost in determining both the speed and the extent of policy transmission (Bernanke, Gertler, and Gilchrist 1999). Thus, understanding how much financial conditions have tightened provides important feedback for calibrating monetary policy.
In past monetary tightening episodes, the degree of tightening in overall financial conditions depended on how much and how long monetary tightening continued, as well as prevailing economic conditions when tightening began. Specifically, the extent of monetary tightening depends on inflationary pressures and how strong the economy is when tightening starts. In past cycles, federal funds rate increases ranged from about 1 percentage point (1965–66) to over 10 percentage points (1977–80).
This Economic Letter compares the size and the speed of financial market responses between current and past cycles of monetary tightening. We focus on analyzing long-term interest rates, stock prices, and credit spreads because they directly affect the cost of capital and thus real economic activity. Since the current tightening cycle is likely still ongoing, the financial market response could still change substantially. Nevertheless, comparing current financial market changes to those during previous tightening cycles sheds light on the speed of adjustment.
Monetary tightening cycles
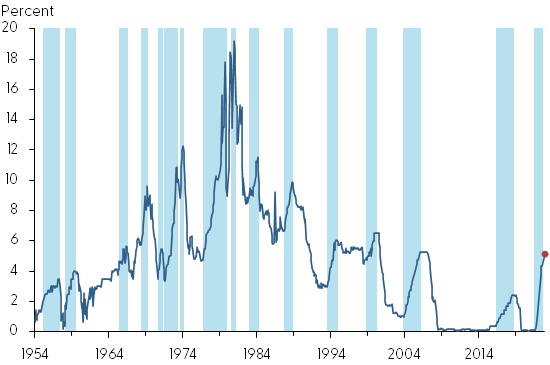
Figure 1 shows the 15 postwar monetary tightening cycles. The first 11 cycles are identified following the methodology in Adrian and Estrella (2008). This assumes that a tightening cycle starts when the federal funds rate rises by 0.25 percentage point (25 basis points) or more in two consecutive months. A tightening cycle ends when either (1) the federal funds rate is higher than at any time from 12 months before to 9 months after and is at least 0.5 percentage point higher than at the beginning of this period, or (2) the federal funds rate is higher than at any time from 6 months before to 6 months after and is 1.5 percentage points higher than the average at these end points.
Figure 1
Effective federal funds rate
Source: Federal Reserve Board of Governors and authors’ calculations.
Note: Blue shading indicates periods of monetary policy tightening as described in text.
Since the late 1990s, forward guidance became a prominent monetary policy tool (Bernanke 2020). We therefore identify the tightening cycles based on the Federal Open Market Committee (FOMC) communications, as financial markets are always forward looking. For example, forward-looking language first appeared in the post-meeting FOMC press release in May 1999. Although the Committee decided not to raise rates at that meeting, the post-meeting press release signaled the FOMC’s bias toward the possibility of a firming in the stance of monetary policy. We therefore assume the 1999–2000 tightening cycle started in May, even though the policy rate did not increase until June.
For the current tightening cycle, the Committee expected after its January 2022 meeting that “it will soon be appropriate to raise the target range for the federal funds rate.” In the December 2022 FOMC Summary of Economic Projections (SEP), the median projection of the federal funds rate for 2023 by FOMC participants was 5.1{21df340e03e388cc75c411746d1a214f72c176b221768b7ada42b4d751988996}, compared to 4.4{21df340e03e388cc75c411746d1a214f72c176b221768b7ada42b4d751988996} for 2022. In this Letter, we make the straightforward assumption that the federal funds rate will reach 5.1{21df340e03e388cc75c411746d1a214f72c176b221768b7ada42b4d751988996} about the middle of this year, based on the contour of the federal funds futures. Hence, the current tightening cycle is assumed to last from January 2022 to May 2023, lifting the federal funds rate from 0.08{21df340e03e388cc75c411746d1a214f72c176b221768b7ada42b4d751988996} to 5.1{21df340e03e388cc75c411746d1a214f72c176b221768b7ada42b4d751988996}.
The federal funds rate
Each tightening cycle has been unique in terms of the duration and the change in the federal funds rate. Not all tightening cycles have been followed by recessions. The median increase in the federal funds rate in past tightening cycles was 2.57 percentage points, and the median pace of tightening was 0.20 percentage point per month. For the current cycle, based on the SEP projections, the expected tightening is 5.02 percentage points at an average pace of 0.31 percentage point per month, both of which are well above the median.
To control for monetary conditions at the onset of tightening, we compute the real funds rate gap by subtracting the inflation rate and the real neutral rate from the nominal federal funds rate. The smaller or more negative the real funds rate gap is, the more monetary accommodation is in the economy. We use the past 12-month change in the consumer price index (CPI) to measure the inflation rate. Although current CPI inflation is an imperfect proxy for expected inflation, the Survey of Professional Forecasters’ expected one-year-ahead inflation rate, which did not start until 1980, provides qualitatively similar results for the last six tightening cycles. We use the real neutral rate estimated by Laubach and Williams (2003). For the current cycle, we use a real neutral rate of 0.5{21df340e03e388cc75c411746d1a214f72c176b221768b7ada42b4d751988996}, which is the difference between the median long-run funds rate of 2.5{21df340e03e388cc75c411746d1a214f72c176b221768b7ada42b4d751988996} from the December SEP and the 2{21df340e03e388cc75c411746d1a214f72c176b221768b7ada42b4d751988996} target inflation rate.
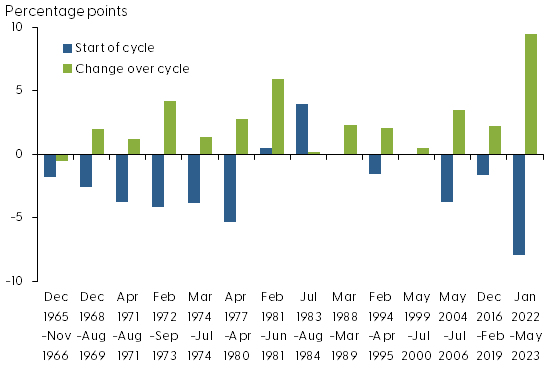
Figure 2 shows the real funds rate gap (blue bars) at the beginning of each tightening cycle. The real funds rate gap of –7.9{21df340e03e388cc75c411746d1a214f72c176b221768b7ada42b4d751988996} at the beginning of the current cycle is the largest among all tightening cycles, in part due to high inflation. Figure 2 also shows the difference in the real funds rate gap between the end and the beginning of each tightening cycle—which reflects how much the gap was closed (green bars). Assuming the inflation rate at the end of the current tightening cycle will be 3.1{21df340e03e388cc75c411746d1a214f72c176b221768b7ada42b4d751988996} based on the December SEP, the real funds rate gap at the end of the current cycle would be 1.5{21df340e03e388cc75c411746d1a214f72c176b221768b7ada42b4d751988996}. If the Fed successfully closes the funds rate gap by 9.4{21df340e03e388cc75c411746d1a214f72c176b221768b7ada42b4d751988996} by the end of the current cycle—through both raising the interest rate and bringing down inflation—it would be the largest gap closure on record.
Figure 2
Real funds rate gap: Initial levels and changes over cycle
Source: Laubach and Williams (2003), Bureau of Labor Statistics, Federal Reserve Board of Governors and authors’ calculations.
Note: Last cycle includes assumptions based on December 2022 SEP projections.
Long-term rates and stock prices
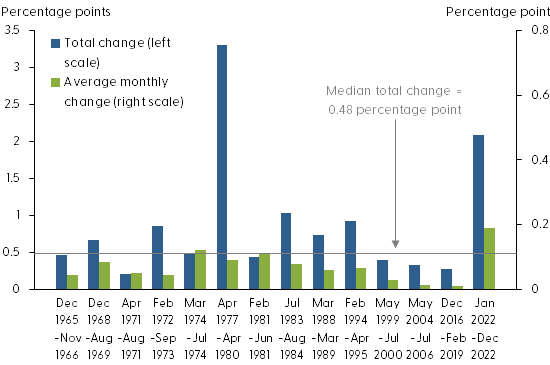
The current increase in the 10-year Treasury rate is the second largest increase of all tightening cycles, shown by the blue bars in Figure 3. Moreover, the green bars show that the speed of this increase has been unprecedented. Research shows that the response of asset prices to anticipated monetary policy changes is essentially zero, while their response to unanticipated movements is large and highly significant (Kuttner 2000). Thus, before forward guidance, each monetary policy tightening may have contained unanticipated information that had not been fully incorporated into asset prices; therefore, without advance communication, financial markets would have reacted to each tightening until the cycle ended.
Figure 3
Percentage point changes in 10-year Treasury yield
Source: Federal Reserve Board of Governors and authors’ calculations.
With forward guidance, market participants can form expectations about tightening cycles, including the expected duration and amount of tightening. Because the expected tightening is fully incorporated into asset prices well before the completion of the tightening cycle, this partially explains the speed of the increase in long-term rates in the current cycle.
A widely held view by economists is that long-term interest rates tend to have relatively bigger effects on real economic activities than short-term rates. This is in part due to the large share of long-term debt contracts with a fixed interest rate in our financial system, including fixed-rate mortgages, term loans, and corporate bonds, whose rates are often tied to long-term Treasury rates. Thus, the rapid increase in long-term rates would cool the economy relatively faster than in previous cycles.
The contract interest rate above the Treasury rate, known as the spread, is another determinant of financial conditions. The spread reflects the risk premium demanded by the lender in providing debt financing to risky borrowers. In past tightening cycles, bond spreads haven’t always tightened, and the median change in the benchmark Baa bond spread was close to zero. Currently, the Baa spread has widened only about 0.06 percentage point, which is small relative to the large increase in the long-term Treasury rate.
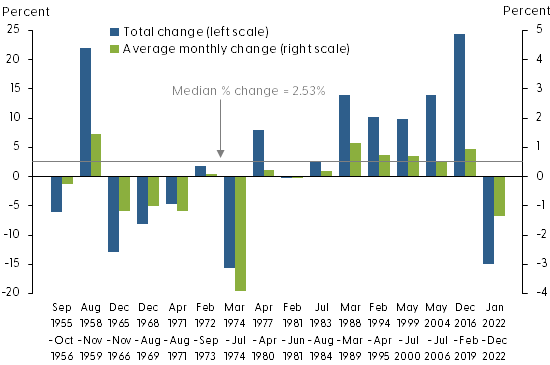
In previous tightening episodes, stock prices initially fell but sometimes rebounded to end the tightening cycle with a net gain. Figure 4 shows that stock prices declined on net in five of the past 15 tightening episodes. The median change in the Standard & Poor’s 500 in previous cycles was +2.53{21df340e03e388cc75c411746d1a214f72c176b221768b7ada42b4d751988996}. Both the current decline in stock prices and the speed of the decline, as measured by the average monthly change in stock prices, are large relative to the historical average. Stock valuations, such as the price-to-earnings ratio, exhibit similar patterns.
Figure 4
Percent changes in Standard & Poor’s 500
Source: Bloomberg, Federal Reserve Board of Governors and authors’ calculations.
Comparing the current changes in bond rates and stock prices to those in previous completed tightening cycles that lasted longer reflects the notion that forward guidance has front-loaded the financial market response in the current cycle. This is consistent with the stance of monetary policy being tighter than what is implied by the federal funds rate (Choi et al. 2022). Repeating the analysis to control for cycle duration yields qualitatively similar results.
Insights from the past
What can we learn from history to understand how financial conditions could play out through the end of this tightening cycle? The historical relation between monetary conditions at the onset of tightening cycles and tightening in interest rates and stock prices may provide some clues. Regressing the real funds rate gap on the change in the federal funds rate yields a significantly negative relationship: a more negative real funds rate gap tends to be followed by a bigger increase in the federal funds rate. Given the large negative real funds rate gap in the current cycle, history suggests that the total increase in the federal funds rate could be bigger than expected.
Regressing the real funds rate gap on the change in stock prices yields a significantly positive relationship, implying that the more negative the real funds rate gap, the larger the decline in stock prices during a tightening cycle. When we use this historical relationship to evaluate stock prices at the large negative funds rate gap, stock prices are projected to decline further. The historical relationship between the funds rate gap and bond spreads also calls for more tightening in the bond market. Taken together, with the historically large funds rate gap at the onset of the current cycle, past experiences indicate that more tightening of financial conditions could follow.
Conclusions
Current increases in the federal funds rate are expected to reverse a historically large negative real funds rate gap at the beginning of the cycle. Successfully closing the real funds rate gap will hinge on substantially reducing the inflation rate. Relative to history, both the size and the speed of tightening in Treasury bonds and common stocks have been large in the current cycle, in part because of the large gap and the Federal Reserve’s forward guidance. While the rapid tightening of financial conditions is expected to slow the economy relatively quickly, historical experiences raise the possibility of even more tightening in financial conditions given the large real rate gap that needs to be closed.
Simon H. Kwan
Senior Research Advisor, Economic Research Department, Federal Reserve Bank of San Francisco
Louis Liu
Research Associate, Economic Research Department, Federal Reserve Bank of San Francisco
References
Adrian, Tobias, and Arturo Estrella. 2008. “Monetary Tightening Cycles and the Predictability of Economic Activity.” Economics Letters 99(2), pp. 260–264.
Bernanke, Ben S. 2020. “The New Tools of Monetary Policy.” American Economic Review 110(4, April), pp. 943–983.
Bernanke, Ben S., Mark Gertler, and Simon Gilchrist. 1999. “The Financial Accelerator in a Quantitative Business Cycle Framework.” Chapter 21 in Handbook of Macroeconomics 1, part C, eds. J.B. Taylor and M. Woodford. Amsterdam: Elsevier, pp. 1,341–1,393.
Choi, Jason, Taeyoung Doh, Andrew Foerster, and Zinnia Martinez. 2022. “Monetary Policy Stance Is Tighter than Federal Funds Rate.” FRBSF Economic Letter 2022-30 (November 7).
Kuttner, Kenneth N. 2001. “Monetary Policy Surprises and Interest Rates: Evidence from the Fed Funds Futures Market.” Journal of Monetary Economics 47(3, June), pp. 523–544.
Laubach, Thomas, and John C. Williams. 2003. “Measuring the Natural Rate of Interest.” Review of Economics and Statistics 85(4, November), pp. 1,063–1,070.